Reclaim TrendSnap Signals
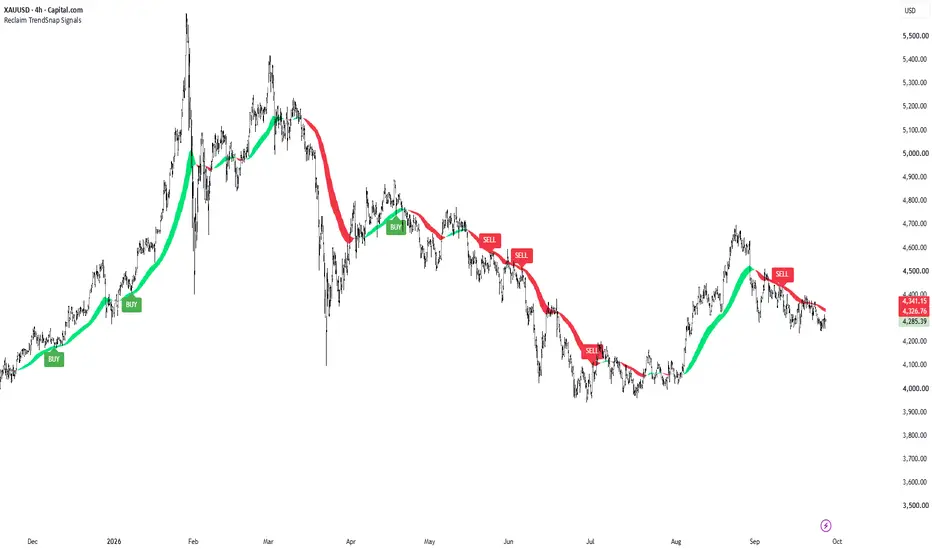
Reclaim TrendSnap Signals
What it does
This indicator tracks trend direction using a smoothed EMA and generates BUY/SELL signals whenever price makes a sharp "reclaim" move back through that EMA after briefly testing the opposite side — a classic pullback-and-continuation pattern.
How it works
1.Trend Detection — The indicator establishes a trend state (up or down) only after two consecutive closes confirm price has settled on one side of the EMA. This filters out single-bar noise and whipsaws.
2.The Reclaim Setup — Once a trend is confirmed:
BUY fires when, during an uptrend, a candle's low dips below the EMA but the candle still opens and closes above it — showing buyers stepped in and reclaimed the level.
SELL fires when, during a downtrend, a candle's high pokes above the EMA but the candle opens and closes below it — showing sellers defended the level.
3.Cooldown Filter — A minimum bar count (Min Bars Between Signals) must pass since the trend last flipped before a new signal can print, avoiding signals that are too close to a fresh trend change.
4.Candle Color Filter (optional) — Tighten signal quality by requiring the reclaim candle to be green (for BUY) or red (for SELL), ensuring the close isn't just barely above/below open.
5.One Signal Per Cycle (optional) — Limits output to a single BUY or SELL per trend cycle, so you get one clean entry signal instead of repeated alerts while the trend persists.
The Visual — TrendSnap Histogram
Instead of a plain EMA line, the trend EMA is displayed as a colored histogram band (lime = EMA rising above its own smoothed trail, red = EMA falling below it), making the underlying trend momentum easier to read at a glance. This is purely visual — the signal logic always uses the raw, unsmoothed EMA underneath.
Best used for
Spotting trend-continuation entries after a shakeout — i.e., catching the moment a pullback fails and price snaps back in the direction of the prevailing trend.
What it does
This indicator tracks trend direction using a smoothed EMA and generates BUY/SELL signals whenever price makes a sharp "reclaim" move back through that EMA after briefly testing the opposite side — a classic pullback-and-continuation pattern.
How it works
1.Trend Detection — The indicator establishes a trend state (up or down) only after two consecutive closes confirm price has settled on one side of the EMA. This filters out single-bar noise and whipsaws.
2.The Reclaim Setup — Once a trend is confirmed:
BUY fires when, during an uptrend, a candle's low dips below the EMA but the candle still opens and closes above it — showing buyers stepped in and reclaimed the level.
SELL fires when, during a downtrend, a candle's high pokes above the EMA but the candle opens and closes below it — showing sellers defended the level.
3.Cooldown Filter — A minimum bar count (Min Bars Between Signals) must pass since the trend last flipped before a new signal can print, avoiding signals that are too close to a fresh trend change.
4.Candle Color Filter (optional) — Tighten signal quality by requiring the reclaim candle to be green (for BUY) or red (for SELL), ensuring the close isn't just barely above/below open.
5.One Signal Per Cycle (optional) — Limits output to a single BUY or SELL per trend cycle, so you get one clean entry signal instead of repeated alerts while the trend persists.
The Visual — TrendSnap Histogram
Instead of a plain EMA line, the trend EMA is displayed as a colored histogram band (lime = EMA rising above its own smoothed trail, red = EMA falling below it), making the underlying trend momentum easier to read at a glance. This is purely visual — the signal logic always uses the raw, unsmoothed EMA underneath.
Best used for
Spotting trend-continuation entries after a shakeout — i.e., catching the moment a pullback fails and price snaps back in the direction of the prevailing trend.

ChartTrader-X
Disclaimer
The information and publications are not meant to be, and do not constitute, financial, investment, trading, or other types of advice or recommendations supplied or endorsed by TradingView. Read more in the Terms of Use.
ChartTrader-X
Disclaimer
The information and publications are not meant to be, and do not constitute, financial, investment, trading, or other types of advice or recommendations supplied or endorsed by TradingView. Read more in the Terms of Use.