OPEN-SOURCE SCRIPT
Bitcoin Power Law Corridor | Astral Vision
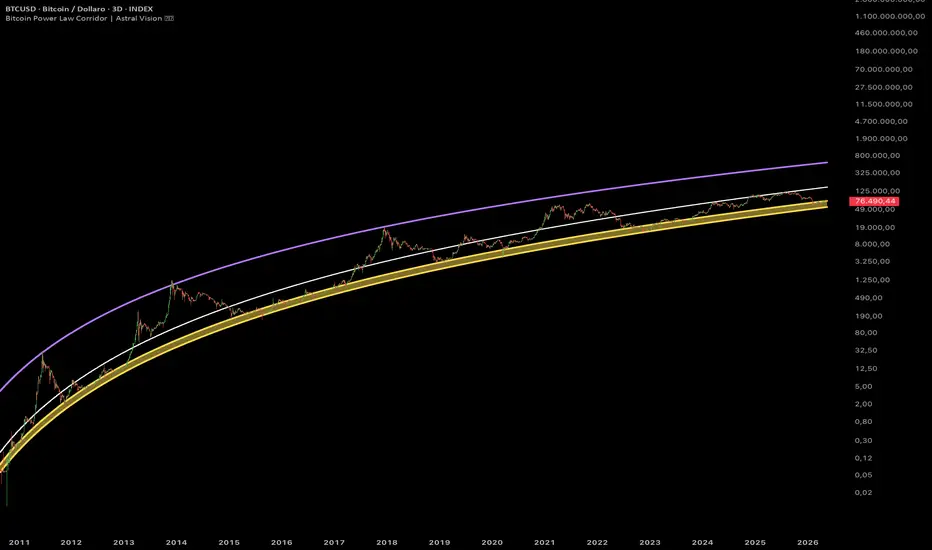
Bitcoin Power Law Corridor | Astral Vision 🌠💠
This indicator plots a mathematically derived price corridor based on the power law relationship between Bitcoin's price and the number of days since its genesis. The power law is a well-documented empirical observation in Bitcoin's price history: when both price and time are plotted on logarithmic scales, the relationship between the two approximates a straight line, meaning price grows as a power function of time rather than linearly or exponentially. This produces a structural corridor that expands over time at a decelerating rate, capturing Bitcoin's long-term appreciation while reflecting its diminishing growth rate across cycles.
Calculation ⚙️
The foundation of the model is the number of days elapsed since July 19, 2010, Bitcoin's reference origin for this model, with a fixed offset of 564 days added to calibrate the day count to the genesis block. Call this value D.
The general form of each line in the corridor is a power law equation expressed in log-log space: the base-10 logarithm of price equals a constant term A plus a slope coefficient B multiplied by the base-10 logarithm of D. In standard notation: log10(price) = A + B × log10(D), which is equivalent to price = 10^(A + B × log10(D)).
The four lines use the following coefficients, each fitted independently to different aspects of Bitcoin's historical price distribution:
Centre line: A = -16.982, B = 5.834. This is the central regression fit through the full price history, representing the median fair value implied by the power law.
Resistance line: A = -13.366, B = 5.029. Fitted to the historical cycle top regions, this line represents the upper boundary of the corridor where Bitcoin has historically found significant selling pressure.
Robust Fit line: A = -17.155, B = 5.799. An alternative regression fit using a method more resistant to outliers, providing a reference closer to the lower half of the price distribution.
Support line: A = -17.432, B = 5.834. Fitted to the historical cycle bottom regions, using the same slope as the centre line but a lower intercept, representing the floor of the corridor where Bitcoin has historically found strong buying interest.
The fill between the Robust Fit and Support lines visually marks the lower corridor zone that has historically corresponded to macro accumulation opportunities.
Because the model is built on day count rather than bar count, the indicator fetches the daily bar index from the reference date using a separate security call, making it produce consistent output regardless of which chart timeframe is active.
Plots 📊
Inputs 🎛️
Colors 🎨
5 Astral Vision presets + custom override. Default: Infinito.
Purpose 🎯
Standard moving averages and trend channels are anchored to recent price action and reset with each new cycle. The power law corridor is anchored to time itself, meaning its positioning is determined entirely by how old Bitcoin is rather than by recent price behavior. This makes it one of the few tools capable of placing any price level in the context of Bitcoin's full historical trajectory: a price that appears high relative to recent months may still be near the bottom of the long-term corridor, or vice versa. The four-line structure further provides distinct reference levels for fair value, upper resistance, and lower support within a single unified framework.
Disclaimer ⭕️
This indicator is for informational and educational purposes only. It does not constitute financial advice. Past performance is not indicative of future results. Always do your own research before making investment decisions.
This indicator plots a mathematically derived price corridor based on the power law relationship between Bitcoin's price and the number of days since its genesis. The power law is a well-documented empirical observation in Bitcoin's price history: when both price and time are plotted on logarithmic scales, the relationship between the two approximates a straight line, meaning price grows as a power function of time rather than linearly or exponentially. This produces a structural corridor that expands over time at a decelerating rate, capturing Bitcoin's long-term appreciation while reflecting its diminishing growth rate across cycles.
Calculation ⚙️
The foundation of the model is the number of days elapsed since July 19, 2010, Bitcoin's reference origin for this model, with a fixed offset of 564 days added to calibrate the day count to the genesis block. Call this value D.
The general form of each line in the corridor is a power law equation expressed in log-log space: the base-10 logarithm of price equals a constant term A plus a slope coefficient B multiplied by the base-10 logarithm of D. In standard notation: log10(price) = A + B × log10(D), which is equivalent to price = 10^(A + B × log10(D)).
The four lines use the following coefficients, each fitted independently to different aspects of Bitcoin's historical price distribution:
Centre line: A = -16.982, B = 5.834. This is the central regression fit through the full price history, representing the median fair value implied by the power law.
Resistance line: A = -13.366, B = 5.029. Fitted to the historical cycle top regions, this line represents the upper boundary of the corridor where Bitcoin has historically found significant selling pressure.
Robust Fit line: A = -17.155, B = 5.799. An alternative regression fit using a method more resistant to outliers, providing a reference closer to the lower half of the price distribution.
Support line: A = -17.432, B = 5.834. Fitted to the historical cycle bottom regions, using the same slope as the centre line but a lower intercept, representing the floor of the corridor where Bitcoin has historically found strong buying interest.
The fill between the Robust Fit and Support lines visually marks the lower corridor zone that has historically corresponded to macro accumulation opportunities.
Because the model is built on day count rather than bar count, the indicator fetches the daily bar index from the reference date using a separate security call, making it produce consistent output regardless of which chart timeframe is active.
Plots 📊
- Centre line: central power law regression through full price history
- Resistance line: upper corridor boundary fitted to historical cycle tops
- Robust Fit line: alternative lower regression using outlier-resistant fitting
- Support line: lower corridor boundary fitted to historical cycle bottoms
- Fill between Robust Fit and Support: lower accumulation zone (toggleable)
Inputs 🎛️
- Plot Line Fill: toggle the fill between Robust Fit and Support lines
Colors 🎨
5 Astral Vision presets + custom override. Default: Infinito.
Purpose 🎯
Standard moving averages and trend channels are anchored to recent price action and reset with each new cycle. The power law corridor is anchored to time itself, meaning its positioning is determined entirely by how old Bitcoin is rather than by recent price behavior. This makes it one of the few tools capable of placing any price level in the context of Bitcoin's full historical trajectory: a price that appears high relative to recent months may still be near the bottom of the long-term corridor, or vice versa. The four-line structure further provides distinct reference levels for fair value, upper resistance, and lower support within a single unified framework.
Disclaimer ⭕️
This indicator is for informational and educational purposes only. It does not constitute financial advice. Past performance is not indicative of future results. Always do your own research before making investment decisions.
Open-source script
In true TradingView spirit, the creator of this script has made it open-source, so that traders can review and verify its functionality. Kudos to the author! While you can use it for free, remember that republishing the code is subject to our House Rules.

My premium indicators are available on Whop:
whop.com/astralvision
Astral Vision 🌠💠
whop.com/astralvision
Astral Vision 🌠💠
Disclaimer
The information and publications are not meant to be, and do not constitute, financial, investment, trading, or other types of advice or recommendations supplied or endorsed by TradingView. Read more in the Terms of Use.
Open-source script
In true TradingView spirit, the creator of this script has made it open-source, so that traders can review and verify its functionality. Kudos to the author! While you can use it for free, remember that republishing the code is subject to our House Rules.
My premium indicators are available on Whop:
whop.com/astralvision
Astral Vision 🌠💠
whop.com/astralvision
Astral Vision 🌠💠
Disclaimer
The information and publications are not meant to be, and do not constitute, financial, investment, trading, or other types of advice or recommendations supplied or endorsed by TradingView. Read more in the Terms of Use.