Updated
Supply and Demand Zones [BigBeluga]
More exclusive indicators from BigBeluga
Subscribe to BigBeluga Premium for $66.47/month to get exclusive indicators by this author. You pay right on TradingView and can use them on your charts straight away.
Explore BigBeluga Premium🔵 OVERVIEW
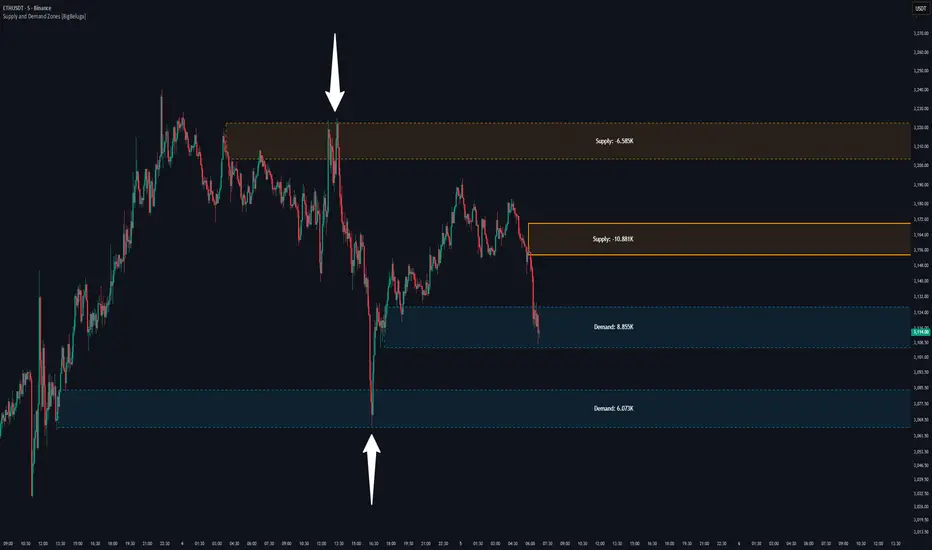
The Supply and Demand Zones [BigBeluga] indicator automatically identifies institutional order zones formed by high-volume price movements. It detects aggressive buying or selling events and marks the origin of these moves as demand or supply zones. Untested zones are plotted with thick solid borders, while tested zones become dashed, signaling reduced strength.
🔵 CONCEPTS
🔵 FEATURES
🔵 HOW TO USE
🔵 CONCLUSION
Supply and Demand Zones [BigBeluga] is a clean and logic-driven tool that visualizes critical liquidity zones formed by institutional moves. It tracks untested and tested levels, giving traders a visual edge to recognize where price might bounce or reverse due to historical order flow.
The Supply and Demand Zones [BigBeluga] indicator automatically identifies institutional order zones formed by high-volume price movements. It detects aggressive buying or selling events and marks the origin of these moves as demand or supply zones. Untested zones are plotted with thick solid borders, while tested zones become dashed, signaling reduced strength.
🔵 CONCEPTS
- Supply Zones: Identified when 3 or more bearish candles form consecutively with above-average volume. The script then searches up to 5 bars back to find the last bullish candle and plots a supply zone from that candle’s low to its low plus ATR.
- Demand Zones: Detected when 3 or more bullish candles appear with above-average volume. The script looks up to 5 bars back for a bearish candle and plots a demand zone from its high to its high minus ATR.
- Volume Weighting: Each zone displays the cumulative bullish or bearish volume within the move leading to the zone.
- Tested Zones: If price re-enters a zone and touches its boundary after being extended for 15 bars, the zone becomes dashed, indicating a potential weakening of that level.
- Overlap Logic: Older overlapping zones are removed automatically to keep the chart clean and only show the most relevant supply/demand levels.
- Zone Expiry: Zones are also deleted after they’re fully broken by price (i.e., price closes above supply or below demand).
🔵 FEATURES
- Auto-detects supply and demand using volume and candle structure.
- Extends valid zones to the right side of the chart.
- Solid borders for fresh untested zones.
- Dashed borders for tested zones (after 15 bars and contact).
- Prevents overlapping zones of the same type.
- Labels each zone with volume delta collected during zone formation.
- Limits to 5 zones of each type for clarity.
- Fully customizable supply and demand zone colors.
🔵 HOW TO USE
- Use supply zones as potential resistance levels where sell-side pressure could emerge.
- Use demand zones as potential support areas where buyers might step in again.
- Pay attention to whether a zone is solid (untested) or dashed (tested).
- Combine with other confluences like volume spikes, trend direction, or candlestick patterns.
- Ideal for swing traders and scalpers identifying key reaction levels.
🔵 CONCLUSION
Supply and Demand Zones [BigBeluga] is a clean and logic-driven tool that visualizes critical liquidity zones formed by institutional moves. It tracks untested and tested levels, giving traders a visual edge to recognize where price might bounce or reverse due to historical order flow.
Release Notes
Update Highlights- Added Delta % Strength to each supply and demand zone, showing relative buying/selling pressure.
- Zones now display volume + percentage contribution for clearer strength comparison.
- Introduced Total Supply Volume vs Total Demand Volume summary for overall market imbalance.
Release Notes
-
🌐 bigbeluga.org/tv - Get access to our powerful tools & indicators.
🔵 Learn More -> docs.bigbeluga.org/
🔵 Join Discord -> go.bigbeluga.org/k65q9bfqfu
All content provided by BigBeluga is for educational purposes only
🔵 Learn More -> docs.bigbeluga.org/
🔵 Join Discord -> go.bigbeluga.org/k65q9bfqfu
All content provided by BigBeluga is for educational purposes only
Disclaimer
The information and publications are not meant to be, and do not constitute, financial, investment, trading, or other types of advice or recommendations supplied or endorsed by TradingView. Read more in the Terms of Use.
🌐 bigbeluga.org/tv - Get access to our powerful tools & indicators.
🔵 Learn More -> docs.bigbeluga.org/
🔵 Join Discord -> go.bigbeluga.org/k65q9bfqfu
All content provided by BigBeluga is for educational purposes only
🔵 Learn More -> docs.bigbeluga.org/
🔵 Join Discord -> go.bigbeluga.org/k65q9bfqfu
All content provided by BigBeluga is for educational purposes only
Disclaimer
The information and publications are not meant to be, and do not constitute, financial, investment, trading, or other types of advice or recommendations supplied or endorsed by TradingView. Read more in the Terms of Use.