OPEN-SOURCE SCRIPT
YTD % / Visible Range % Table
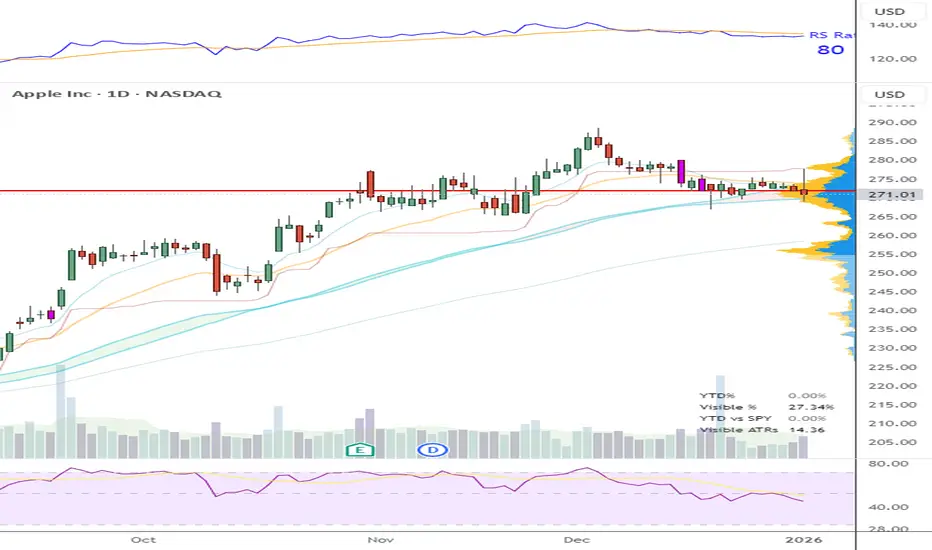
AUTHOR: Brandon Gum
DATE: 2026-01-03
// PURPOSE:
// Calculates price-range metrics based on the *currently visible*
// portion of the chart. Intended for table-based UI display where
// values must be stable and evaluated only on the last bar.
//
// Originally based on Jeff Sun's ADR price data table.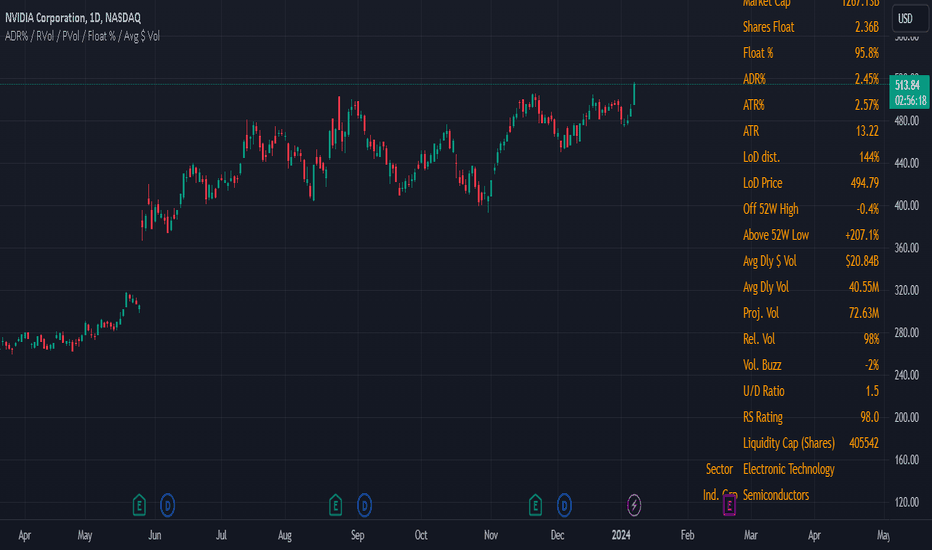
//
// METRICS RETURNED:
// - Visible High
// - Visible Low
// - Visible % Range = (Visible High - Visible Low) / Visible Low
// - Visible ATRs = (Visible High - Visible Low) / ATR
//
// IMPLEMENTATION NOTES:
// - Logic executes ONLY on barstate.islast to avoid state corruption.
// - Visible range is recomputed atomically using a backward loop
// bounded by chart.left_visible_bar_time.
// - Avoids var-based accumulation and bar-by-bar resets, which are
// unreliable when visible window changes.
// - ATR is evaluated at the current bar (not averaged over range).
//
// ASSUMPTIONS / LIMITATIONS:
// - Uses chart-visible time boundaries supplied by TradingView.
// - Loop upper bound must be sufficiently large to cover max
// expected visible bars.
// - Intended for display purposes, not signal generation.
//
// SIDE EFFECTS:
// - None. No plots, no drawings, no state persistence.
DATE: 2026-01-03
// PURPOSE:
// Calculates price-range metrics based on the *currently visible*
// portion of the chart. Intended for table-based UI display where
// values must be stable and evaluated only on the last bar.
//
// Originally based on Jeff Sun's ADR price data table.
//
// METRICS RETURNED:
// - Visible High
// - Visible Low
// - Visible % Range = (Visible High - Visible Low) / Visible Low
// - Visible ATRs = (Visible High - Visible Low) / ATR
//
// IMPLEMENTATION NOTES:
// - Logic executes ONLY on barstate.islast to avoid state corruption.
// - Visible range is recomputed atomically using a backward loop
// bounded by chart.left_visible_bar_time.
// - Avoids var-based accumulation and bar-by-bar resets, which are
// unreliable when visible window changes.
// - ATR is evaluated at the current bar (not averaged over range).
//
// ASSUMPTIONS / LIMITATIONS:
// - Uses chart-visible time boundaries supplied by TradingView.
// - Loop upper bound must be sufficiently large to cover max
// expected visible bars.
// - Intended for display purposes, not signal generation.
//
// SIDE EFFECTS:
// - None. No plots, no drawings, no state persistence.
Open-source script
In true TradingView spirit, the creator of this script has made it open-source, so that traders can review and verify its functionality. Kudos to the author! While you can use it for free, remember that republishing the code is subject to our House Rules.

-If you find this idea interesting please leave a like
-Follow for more
-Comments are always welcomed and appreciated
-Follow for more
-Comments are always welcomed and appreciated
Disclaimer
The information and publications are not meant to be, and do not constitute, financial, investment, trading, or other types of advice or recommendations supplied or endorsed by TradingView. Read more in the Terms of Use.
Open-source script
In true TradingView spirit, the creator of this script has made it open-source, so that traders can review and verify its functionality. Kudos to the author! While you can use it for free, remember that republishing the code is subject to our House Rules.
-If you find this idea interesting please leave a like
-Follow for more
-Comments are always welcomed and appreciated
-Follow for more
-Comments are always welcomed and appreciated
Disclaimer
The information and publications are not meant to be, and do not constitute, financial, investment, trading, or other types of advice or recommendations supplied or endorsed by TradingView. Read more in the Terms of Use.