OPEN-SOURCE SCRIPT
Mayer Multiple | Astral Vision
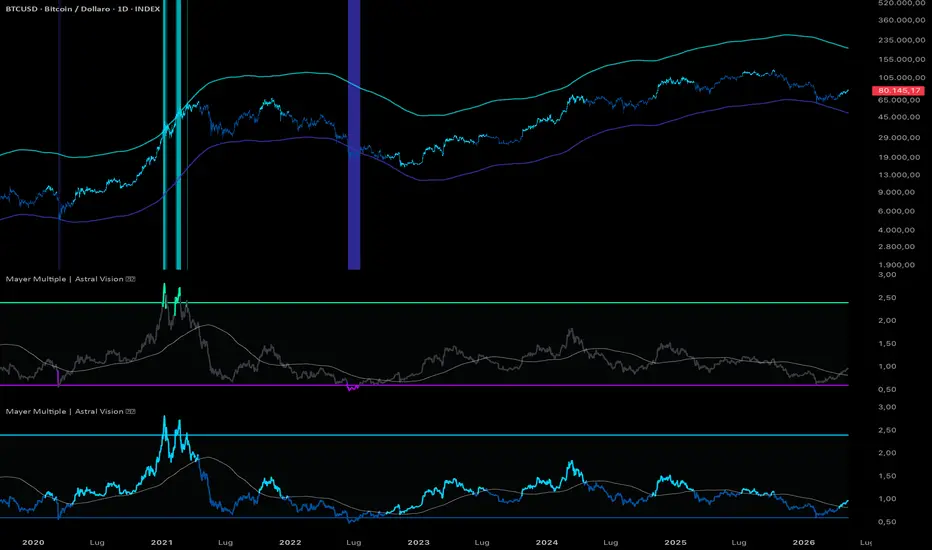
Mayer Multiple | Astral Vision 🌠💠
The Mayer Multiple divides Bitcoin's price by its moving average, expressing how extended or compressed price is relative to its long-term trend.
Readings above 2.4 have historically marked distribution zones; readings below 0.6 have marked generational accumulation opportunities.
Unlike most implementations that treat the Mayer Multiple as a static valuation tool, this version adds a configurable moving average of the multiple itself, enabling trend analysis directly on the oscillator.
Valuation mode colors by threshold breach.
Trend mode colors continuously by whether the multiple is above or below its own MA.
Both the SMA length and the multiple MA length are fully adjustable, and overbought/oversold thresholds are user-defined rather than fixed.
Price-space bands are projected directly onto the chart showing the exact levels where each threshold would be reached.
Calculation ⚙️
`Mayer Multiple = BTC Price / SMA(Price, length)`
`Multiple MA = SMA(Multiple, length)`
`Price OB = OB threshold × SMA`
`Price OS = OS threshold × SMA`
Disclaimer 🎯
This indicator is a personal research tool for educational and informational purposes only. It does not constitute financial advice or investment recommendation of any kind. I am not affiliated with any financial institution, research firm, or organization. Always conduct your own research before making any financial decision.
Inputs 🎛️
- `Color Mode` Valuation (threshold-based) or Trend (above/below multiple MA)
- `Price SMA Length` moving average length for the multiple calculation (default 200)
- `Multiple SMA Length` moving average applied to the multiple itself (default 200)
- `Overbought / Oversold Threshold` user-defined valuation extremes (default 2.4 / 0.6)
Colors 🎨
5 Astral Vision presets + custom override. Default: Paradiso.
Plots 📊
- Mayer Multiple oscillator colored by active mode
- Multiple moving average signal baseline
- Overbought / oversold threshold lines with fill between
- Price-space OB / OS bands projected onto the chart
- Background highlight when price breaches either band
- Candle coloring by active regime
The Mayer Multiple divides Bitcoin's price by its moving average, expressing how extended or compressed price is relative to its long-term trend.
Readings above 2.4 have historically marked distribution zones; readings below 0.6 have marked generational accumulation opportunities.
Unlike most implementations that treat the Mayer Multiple as a static valuation tool, this version adds a configurable moving average of the multiple itself, enabling trend analysis directly on the oscillator.
Valuation mode colors by threshold breach.
Trend mode colors continuously by whether the multiple is above or below its own MA.
Both the SMA length and the multiple MA length are fully adjustable, and overbought/oversold thresholds are user-defined rather than fixed.
Price-space bands are projected directly onto the chart showing the exact levels where each threshold would be reached.
Calculation ⚙️
`Mayer Multiple = BTC Price / SMA(Price, length)`
`Multiple MA = SMA(Multiple, length)`
`Price OB = OB threshold × SMA`
`Price OS = OS threshold × SMA`
Disclaimer 🎯
This indicator is a personal research tool for educational and informational purposes only. It does not constitute financial advice or investment recommendation of any kind. I am not affiliated with any financial institution, research firm, or organization. Always conduct your own research before making any financial decision.
Inputs 🎛️
- `Color Mode` Valuation (threshold-based) or Trend (above/below multiple MA)
- `Price SMA Length` moving average length for the multiple calculation (default 200)
- `Multiple SMA Length` moving average applied to the multiple itself (default 200)
- `Overbought / Oversold Threshold` user-defined valuation extremes (default 2.4 / 0.6)
Colors 🎨
5 Astral Vision presets + custom override. Default: Paradiso.
Plots 📊
- Mayer Multiple oscillator colored by active mode
- Multiple moving average signal baseline
- Overbought / oversold threshold lines with fill between
- Price-space OB / OS bands projected onto the chart
- Background highlight when price breaches either band
- Candle coloring by active regime
Open-source script
In true TradingView spirit, the creator of this script has made it open-source, so that traders can review and verify its functionality. Kudos to the author! While you can use it for free, remember that republishing the code is subject to our House Rules.

My premium indicators are available on Whop:
whop.com/astralvision
Astral Vision 🌠💠
whop.com/astralvision
Astral Vision 🌠💠
Disclaimer
The information and publications are not meant to be, and do not constitute, financial, investment, trading, or other types of advice or recommendations supplied or endorsed by TradingView. Read more in the Terms of Use.
Open-source script
In true TradingView spirit, the creator of this script has made it open-source, so that traders can review and verify its functionality. Kudos to the author! While you can use it for free, remember that republishing the code is subject to our House Rules.
My premium indicators are available on Whop:
whop.com/astralvision
Astral Vision 🌠💠
whop.com/astralvision
Astral Vision 🌠💠
Disclaimer
The information and publications are not meant to be, and do not constitute, financial, investment, trading, or other types of advice or recommendations supplied or endorsed by TradingView. Read more in the Terms of Use.