OPEN-SOURCE SCRIPT
Updated Minicharts Pro+ [Herman]
Minicharts Pro+ [Herman]
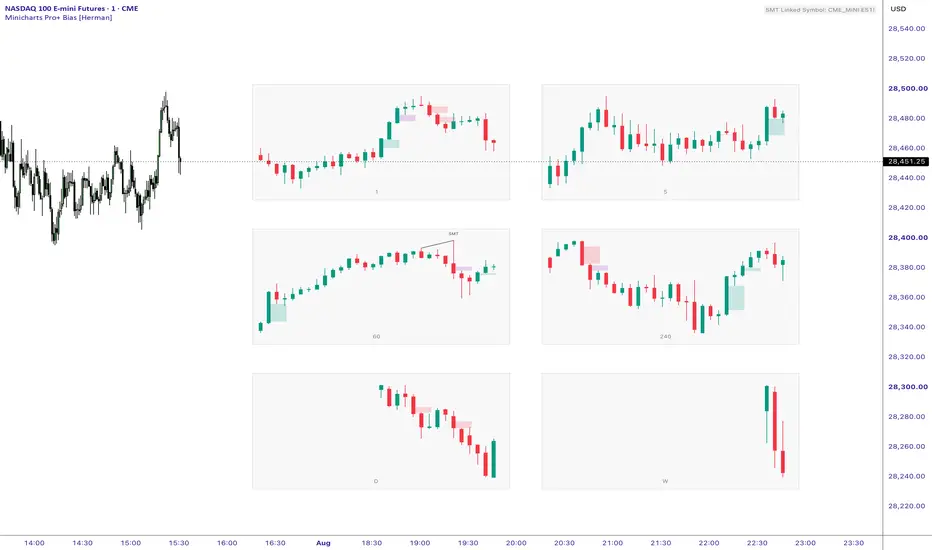
Minicharts Pro+ [Herman] is a multi-timeframe visualization tool designed to display higher timeframe price action directly on your current chart.
The script renders multiple compact “mini charts” representing selected timeframes, allowing users to observe structure, candle behavior, and relative positioning without switching between charts.
It is intended for traders who want to maintain awareness of higher timeframe context while working on a lower timeframe, without interrupting their workflow.
Purpose
The main purpose of this tool is to improve chart workflow and situational awareness by:
Providing a clear overview of multiple timeframes in one place
Reducing the need to switch between charts
Helping users visually align lower timeframe activity with higher timeframe structure
This script is designed as a visual analysis aid and can be used alongside any trading methodology.
How it works
The indicator uses request.security() to retrieve OHLC data from selected timeframes and reconstructs them as miniature charts displayed on the right side of the screen.
Each mini chart:
Displays historical candles from the selected timeframe
Is scaled dynamically based on recent price range and volatility
Is rendered independently to preserve clarity of structure
The layout is organized in a grid format, where each panel represents a different timeframe.
Users can adjust positioning, spacing, and sizing to fit their chart preferences.
Moving Averages & VWAP
Each mini chart includes optional overlays for additional visual context:
EMA (Exponential Moving Average)
VWAP (Volume Weighted Average Price)
These can be enabled or disabled individually for each mini chart, allowing flexible customization depending on user preference.
Both EMA and VWAP are calculated using standard methods based on the selected timeframe data and are displayed purely for reference.
SMT (Intermarket Comparison)
The script includes an optional SMT-style comparison feature between correlated instruments.
By default, the script automatically selects a related symbol (e.g., NQ ↔ ES, GC ↔ SI)
Users can manually override the symbol if needed
Pivot-based comparisons are used to highlight differences in swing highs and lows between instruments
This feature provides a visual way to compare price behavior between instruments and is based solely on historical price data.
HTF FVG Visualization
Optional higher timeframe imbalance (FVG) zones can be displayed within each mini chart.
Both standard and inverted FVG structures are supported
Users can choose between extended zones or next-bar-only display
Only the most recent inverted FVG is highlighted to reduce visual clutter
These zones are derived from candle relationships within the selected timeframe and are provided for visual reference only.
Inputs & Customization
The script provides multiple configuration options to adapt to different workflows:
Minicharts Setup
Up to 6 independent timeframes
Enable/disable each mini chart
Optional SMT overlay per timeframe
Individual EMA and VWAP toggles per mini chart
SMT Configuration
Automatic or manual symbol selection
Pivot lookback setting
Custom colors for high/low comparisons
HTF FVG Configuration
Enable/disable FVG display
Extension mode selection
Custom colors for bullish, bearish, and inverted zones
Style & Layout
Number of candles displayed per mini chart
Spacing and positioning
Chart size and grid layout
Candle colors and background frames
Timeframe label visibility
Notes
This script is designed for visualization purposes only
It does not generate trading signals, alerts, or recommendations
All calculations are based on historical price data
The tool is intended to support chart analysis, not replace independent decision-making
Minicharts Pro+ [Herman] is a multi-timeframe visualization tool designed to display higher timeframe price action directly on your current chart.
The script renders multiple compact “mini charts” representing selected timeframes, allowing users to observe structure, candle behavior, and relative positioning without switching between charts.
It is intended for traders who want to maintain awareness of higher timeframe context while working on a lower timeframe, without interrupting their workflow.
Purpose
The main purpose of this tool is to improve chart workflow and situational awareness by:
Providing a clear overview of multiple timeframes in one place
Reducing the need to switch between charts
Helping users visually align lower timeframe activity with higher timeframe structure
This script is designed as a visual analysis aid and can be used alongside any trading methodology.
How it works
The indicator uses request.security() to retrieve OHLC data from selected timeframes and reconstructs them as miniature charts displayed on the right side of the screen.
Each mini chart:
Displays historical candles from the selected timeframe
Is scaled dynamically based on recent price range and volatility
Is rendered independently to preserve clarity of structure
The layout is organized in a grid format, where each panel represents a different timeframe.
Users can adjust positioning, spacing, and sizing to fit their chart preferences.
Moving Averages & VWAP
Each mini chart includes optional overlays for additional visual context:
EMA (Exponential Moving Average)
VWAP (Volume Weighted Average Price)
These can be enabled or disabled individually for each mini chart, allowing flexible customization depending on user preference.
Both EMA and VWAP are calculated using standard methods based on the selected timeframe data and are displayed purely for reference.
SMT (Intermarket Comparison)
The script includes an optional SMT-style comparison feature between correlated instruments.
By default, the script automatically selects a related symbol (e.g., NQ ↔ ES, GC ↔ SI)
Users can manually override the symbol if needed
Pivot-based comparisons are used to highlight differences in swing highs and lows between instruments
This feature provides a visual way to compare price behavior between instruments and is based solely on historical price data.
HTF FVG Visualization
Optional higher timeframe imbalance (FVG) zones can be displayed within each mini chart.
Both standard and inverted FVG structures are supported
Users can choose between extended zones or next-bar-only display
Only the most recent inverted FVG is highlighted to reduce visual clutter
These zones are derived from candle relationships within the selected timeframe and are provided for visual reference only.
Inputs & Customization
The script provides multiple configuration options to adapt to different workflows:
Minicharts Setup
Up to 6 independent timeframes
Enable/disable each mini chart
Optional SMT overlay per timeframe
Individual EMA and VWAP toggles per mini chart
SMT Configuration
Automatic or manual symbol selection
Pivot lookback setting
Custom colors for high/low comparisons
HTF FVG Configuration
Enable/disable FVG display
Extension mode selection
Custom colors for bullish, bearish, and inverted zones
Style & Layout
Number of candles displayed per mini chart
Spacing and positioning
Chart size and grid layout
Candle colors and background frames
Timeframe label visibility
Notes
This script is designed for visualization purposes only
It does not generate trading signals, alerts, or recommendations
All calculations are based on historical price data
The tool is intended to support chart analysis, not replace independent decision-making
Release Notes
bug fixRelease Notes
bug fixRelease Notes
Update: Bias FrameworkThis update adds a new Bias Framework directly inside each mini chart panel.
The Bias Framework is designed to help users read recent higher timeframe candle interaction more clearly without switching charts. It classifies the most recent completed candle against the previous completed candle on each selected mini chart timeframe.
How the Bias Framework works:
The script compares two completed candles inside each mini chart:
C1 = previous completed candle
C2 = most recent completed candle
The framework evaluates how C2 interacts with the high and low of C1.
Classification logic:
Bullish Bias:
If C2 sweeps below the previous candle low but closes back above that level, the framework classifies the reaction as bullish. This means price moved below the prior candle range but failed to accept lower prices.
Bearish Bias:
If C2 sweeps above the previous candle high but closes back below that level, the framework classifies the reaction as bearish. This means price moved above the prior candle range but failed to accept higher prices.
Bullish Acceptance:
If C2 sweeps above the previous candle high and closes above that high, the framework classifies the candle as bullish. This represents acceptance above the prior candle range.
Bearish Acceptance:
If C2 sweeps below the previous candle low and closes below that low, the framework classifies the candle as bearish. This represents acceptance below the prior candle range.
Avoid:
If C2 stays completely inside the previous candle range, the framework marks the condition as AVOID.
If C2 sweeps both the previous high and previous low, the framework also marks the condition as AVOID because the candle interaction is mixed and does not provide clean directional structure.
Visual Output:
When enabled, the Bias Framework displays a text label above each mini chart panel:
BULLISH
BEARISH
AVOID X
The label color is fully customizable.
The update also includes an optional candle highlight feature. When enabled, the most recent candle pair used for the bias calculation is highlighted with a subtle background strip and a small colored line at the bottom of the mini chart panel.
Bias Framework Settings:
Show Bias Labels:
Turns the BULLISH / BEARISH / AVOID X labels on or off.
Highlight Signal Candles:
Highlights the candle area used for the current bias calculation.
Bullish Bias Color:
Controls the color used for bullish bias labels and highlights.
Bearish Bias Color:
Controls the color used for bearish bias labels and highlights.
Avoid Bias Color:
Controls the color used when the framework marks the condition as AVOID.
Important Notes:
The Bias Framework is a visual structure classification tool only.
It does not generate buy or sell signals.
It does not place trades.
It does not provide financial advice or trading recommendations.
It is designed to support multi-timeframe analysis by showing how the most recent completed candle interacts with the previous completed candle on each selected timeframe.
The tool should be used as contextual support alongside the trader’s own analysis, risk management, and execution model.
Release Notes
The indicator is now cleaner, faster and more accurate.What’s new:
• Correct lower-timeframe data
• Exact candle count on every minichart
• Improved EMA and VWAP performance
• New SMT and DEV SMT signals
• Custom SMT colors and line thickness
• Cleaner default chart with EMA, VWAP and bias labels turned off
Open-source script
In true TradingView spirit, the creator of this script has made it open-source, so that traders can review and verify its functionality. Kudos to the author! While you can use it for free, remember that republishing the code is subject to our House Rules.

Disclaimer
The information and publications are not meant to be, and do not constitute, financial, investment, trading, or other types of advice or recommendations supplied or endorsed by TradingView. Read more in the Terms of Use.
Open-source script
In true TradingView spirit, the creator of this script has made it open-source, so that traders can review and verify its functionality. Kudos to the author! While you can use it for free, remember that republishing the code is subject to our House Rules.
Disclaimer
The information and publications are not meant to be, and do not constitute, financial, investment, trading, or other types of advice or recommendations supplied or endorsed by TradingView. Read more in the Terms of Use.