OPEN-SOURCE SCRIPT
ADR Contraction Tightness
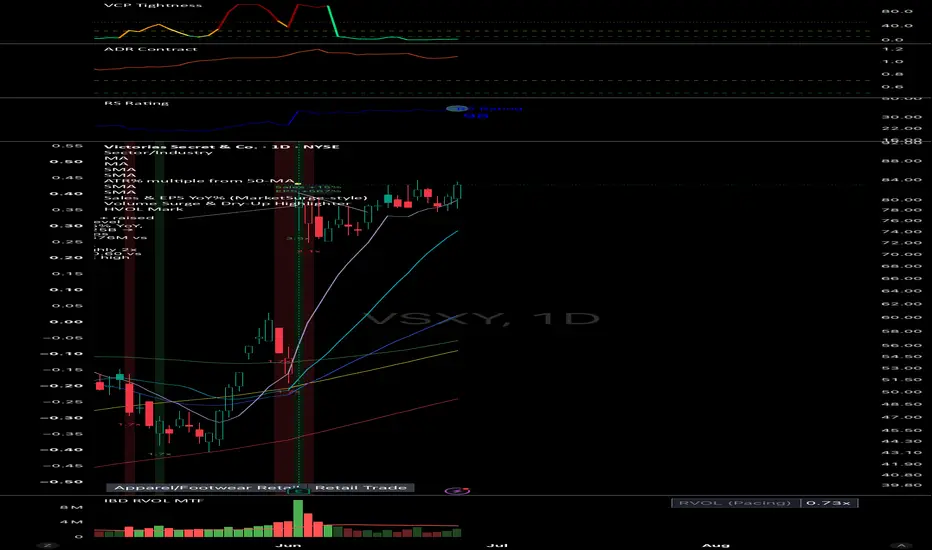
HAT IT IS
// Measures how much a stock's recent daily range has dried up versus its
// ~2.5-month baseline. A single ratio:
//
// bar_range_pct = (high - low) / low * 100 // each bar's range %
// adr_pct_short = ta.sma(bar_range_pct, 20) // recent avg daily range %
// adr_pct_long = ta.sma(bar_range_pct, 50) // baseline avg daily range %
// contraction_ratio = adr_pct_short / adr_pct_long // LOWER = TIGHTER
//
// "Tight base" when contraction_ratio <= 1.00
// "Super-tight" when contraction_ratio <= 0.70
//
// STUDY PROVENANCE
// This is measure B_0.7 ("absolute ADR% contraction") — the tightness
// measure that won the ATR Extension Study tightness-measure bake-off
// (engine: atr_phase7.py §15.6, branch atr-study). In that study B_0.7 was
// the most selective qualifier of the +50% movers: best P(+50%) lift and
// ~10 days faster to the move, versus the old normalized 0–100 VCP score
// which fired on ~99% of names. Lower = tighter. This replaces the VCP
// Tightness Score pane and is built to feed a TradingView Pine Screener.
// Measures how much a stock's recent daily range has dried up versus its
// ~2.5-month baseline. A single ratio:
//
// bar_range_pct = (high - low) / low * 100 // each bar's range %
// adr_pct_short = ta.sma(bar_range_pct, 20) // recent avg daily range %
// adr_pct_long = ta.sma(bar_range_pct, 50) // baseline avg daily range %
// contraction_ratio = adr_pct_short / adr_pct_long // LOWER = TIGHTER
//
// "Tight base" when contraction_ratio <= 1.00
// "Super-tight" when contraction_ratio <= 0.70
//
// STUDY PROVENANCE
// This is measure B_0.7 ("absolute ADR% contraction") — the tightness
// measure that won the ATR Extension Study tightness-measure bake-off
// (engine: atr_phase7.py §15.6, branch atr-study). In that study B_0.7 was
// the most selective qualifier of the +50% movers: best P(+50%) lift and
// ~10 days faster to the move, versus the old normalized 0–100 VCP score
// which fired on ~99% of names. Lower = tighter. This replaces the VCP
// Tightness Score pane and is built to feed a TradingView Pine Screener.
Open-source script
In true TradingView spirit, the creator of this script has made it open-source, so that traders can review and verify its functionality. Kudos to the author! While you can use it for free, remember that republishing the code is subject to our House Rules.

Disclaimer
The information and publications are not meant to be, and do not constitute, financial, investment, trading, or other types of advice or recommendations supplied or endorsed by TradingView. Read more in the Terms of Use.
Open-source script
In true TradingView spirit, the creator of this script has made it open-source, so that traders can review and verify its functionality. Kudos to the author! While you can use it for free, remember that republishing the code is subject to our House Rules.
Disclaimer
The information and publications are not meant to be, and do not constitute, financial, investment, trading, or other types of advice or recommendations supplied or endorsed by TradingView. Read more in the Terms of Use.