OPEN-SOURCE SCRIPT
Adaptive Pressure Trail [JOAT]
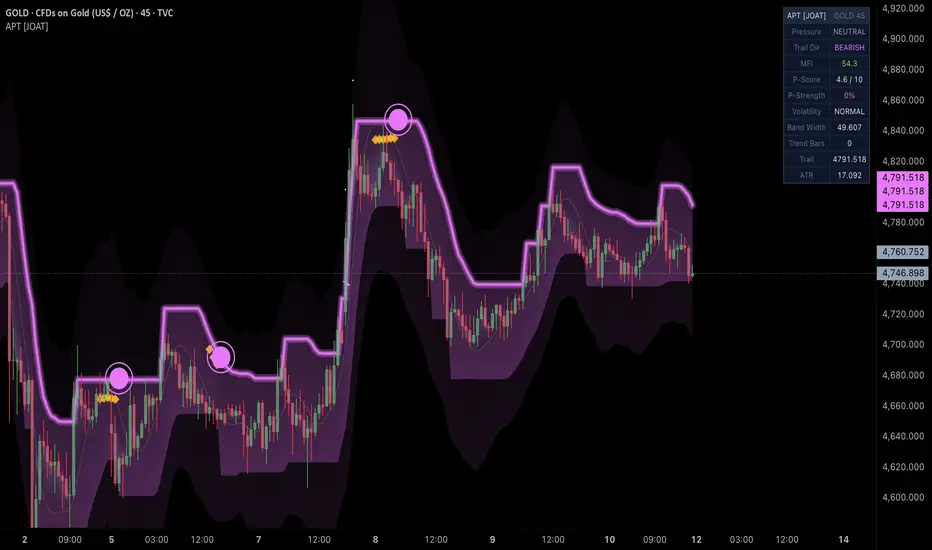
Adaptive Pressure Trail [JOAT]
Introduction
Adaptive Pressure Trail [JOAT] is an open-source overlay indicator that combines an HMA-based adaptive ratchet trail with a custom volume-weighted Money Flow Index to classify bars into bull pressure, bear pressure, and neutral states. The system uses a three-layer visual architecture — an outer volatility cloud, an inner ratchet band fill, and a core gradient pressure fill between the HMA baseline and candle mid-body — to create a clear, spatially organized picture of momentum and direction on any chart. Volatility squeeze detection identifies compression phases before potential breakouts, and high-confidence signals fire when a squeeze releases simultaneously with pressure alignment.
The core problem this indicator solves is that most trail-based systems are either too reactive (flipping constantly on noise) or too slow (missing meaningful moves). The HMA ratchet addresses this: the upper band only falls and the lower band only rises after a direction flip, preventing whipsaw while remaining responsive when momentum is genuine. Layering a volume-weighted MFI filter on top means a directional trail alone is not sufficient — volume-backed money flow must confirm the move before the indicator reports active pressure.

Core Concepts
1. HMA Adaptive Ratchet Trail
The trail baseline is computed using a Hull Moving Average, which provides low lag while remaining smooth. ATR-scaled upper and lower bands are applied around the HMA. The ratchet rule prevents band noise: the upper band can only move downward (or reset when price closes above it), and the lower band can only move upward (or reset when price closes below it). Direction flips when price closes through the active band. This creates a one-directional drift that is far more stable than a raw crossover trail:
The trail direction variable persists with var and updates each bar. Direction == 1 means the lower band is the active trail (bullish), direction == -1 means the upper band is the active trail (bearish).
2. Custom Volume-Weighted MFI
Rather than using a standard price-only momentum oscillator, the pressure engine uses a custom volume-weighted Money Flow Index. Positive flow is volume multiplied by HLC3 on bars where HLC3 increased; negative flow is volume multiplied by HLC3 on bars where HLC3 decreased. These are summed over the MFI length and converted to a 0-100 scale using the RSI formula. The result is smoothed with an HMA for responsiveness. This produces a momentum measure that is inherently volume-weighted — large-volume moves carry more influence than low-volume drift. The MFI is further smoothed to distinguish sustained pressure from transient spikes.
3. Pressure Regime Classification
Bull pressure is active when the trail direction is bullish AND the smoothed MFI is above the bull threshold. Bear pressure is active when the trail direction is bearish AND MFI is below the bear threshold. Neutral is everything else. This dual-condition structure means you need both directional commitment from the ratchet trail AND volume-backed momentum to enter a pressure state. Either condition alone is insufficient.
A rolling 50-bar history tracks what percentage of recent bars were in an active pressure state, producing a Pressure Strength percentage that indicates whether the current regime has been sustained or is a brief spike.
4. Squeeze Detection
Band width — the distance between the upper and lower ratchet bands — is compared to its own SMA. When band width drops below 72% of its recent average, the market is compressing. A squeeze start fires a golden diamond marker at the trail level. A squeeze release fires a larger circle marker. The high-confidence signal fires when a squeeze release coincides with an active pressure state, identifying the highest-probability setups where compressed volatility breaks out in a confirmed directional context.
5. Three-Layer Visual Architecture
The chart renders three nested visual layers:
The trail line itself uses three stacked plots at widths 10, 5, and 2 to create a neon glow shadow effect. Bar coloring uses color.from_gradient driven by MFI intensity, producing increasingly saturated candles as momentum builds.

Features
Input Parameters
Adaptive Trail:
Pressure Filter:
Signals:
Visuals:
How to Use This Indicator
Primary Setup — Trend Following with Pressure Confirmation:
Look for the trail to flip direction (circle marker on trail). Wait for MFI to cross the bull or bear threshold, confirming the pressure state activates. Enter in the trail direction once the pressure fill color saturates. Trail your stop at the active trail line. Exit on a TP signal or when the pressure state deactivates.
High-Confidence Setup:
Wait for squeeze markers (golden diamonds) to appear, indicating compression. When the squeeze releases (larger circle flash) and the pressure state is simultaneously active, the HC LONG or HC SHORT label fires. These are the setups where compressed volatility breaks out with momentum behind it.
Filtering with Pressure Strength:
The dashboard Pressure Strength percentage tells you how sustained the current move has been. Values above 60% indicate a mature trend. Values below 30% indicate the pressure state is new or unstable. Adjust position sizing accordingly.
Reading Impulse Candles:
Volume impulse labels (e.g., "2.1x vol") mark bars where a strong directional move was accompanied by significantly elevated volume. These often mark the start or acceleration of a pressure phase and can serve as reference points for support/resistance.
APT dashboard showing bull pressure active, MFI at 71.2, P-Score 7.1/10, P-Strength at 64%, band width expanding after a squeeze release, and the trail at current price with ATR reference
Indicator Limitations
Originality Statement
This indicator is original in its combination of a ratchet-constrained HMA trail with a custom volume-weighted MFI, the three-layer nested visual system, and the squeeze-breakout confluence signal. While HMA trails and MFI oscillators exist independently, this publication is justified because:
Disclaimer
This indicator is provided for educational and informational purposes only and does not constitute financial advice or a recommendation to buy or sell any financial instrument. Past performance of any pattern or signal does not guarantee future results. All trading involves substantial risk. Always use proper risk management and conduct your own independent analysis.
— Made with passion by officialjackofalltrades
Introduction
Adaptive Pressure Trail [JOAT] is an open-source overlay indicator that combines an HMA-based adaptive ratchet trail with a custom volume-weighted Money Flow Index to classify bars into bull pressure, bear pressure, and neutral states. The system uses a three-layer visual architecture — an outer volatility cloud, an inner ratchet band fill, and a core gradient pressure fill between the HMA baseline and candle mid-body — to create a clear, spatially organized picture of momentum and direction on any chart. Volatility squeeze detection identifies compression phases before potential breakouts, and high-confidence signals fire when a squeeze releases simultaneously with pressure alignment.
The core problem this indicator solves is that most trail-based systems are either too reactive (flipping constantly on noise) or too slow (missing meaningful moves). The HMA ratchet addresses this: the upper band only falls and the lower band only rises after a direction flip, preventing whipsaw while remaining responsive when momentum is genuine. Layering a volume-weighted MFI filter on top means a directional trail alone is not sufficient — volume-backed money flow must confirm the move before the indicator reports active pressure.
Core Concepts
1. HMA Adaptive Ratchet Trail
The trail baseline is computed using a Hull Moving Average, which provides low lag while remaining smooth. ATR-scaled upper and lower bands are applied around the HMA. The ratchet rule prevents band noise: the upper band can only move downward (or reset when price closes above it), and the lower band can only move upward (or reset when price closes below it). Direction flips when price closes through the active band. This creates a one-directional drift that is far more stable than a raw crossover trail:
The trail direction variable persists with var and updates each bar. Direction == 1 means the lower band is the active trail (bullish), direction == -1 means the upper band is the active trail (bearish).
2. Custom Volume-Weighted MFI
Rather than using a standard price-only momentum oscillator, the pressure engine uses a custom volume-weighted Money Flow Index. Positive flow is volume multiplied by HLC3 on bars where HLC3 increased; negative flow is volume multiplied by HLC3 on bars where HLC3 decreased. These are summed over the MFI length and converted to a 0-100 scale using the RSI formula. The result is smoothed with an HMA for responsiveness. This produces a momentum measure that is inherently volume-weighted — large-volume moves carry more influence than low-volume drift. The MFI is further smoothed to distinguish sustained pressure from transient spikes.
3. Pressure Regime Classification
Bull pressure is active when the trail direction is bullish AND the smoothed MFI is above the bull threshold. Bear pressure is active when the trail direction is bearish AND MFI is below the bear threshold. Neutral is everything else. This dual-condition structure means you need both directional commitment from the ratchet trail AND volume-backed momentum to enter a pressure state. Either condition alone is insufficient.
A rolling 50-bar history tracks what percentage of recent bars were in an active pressure state, producing a Pressure Strength percentage that indicates whether the current regime has been sustained or is a brief spike.
4. Squeeze Detection
Band width — the distance between the upper and lower ratchet bands — is compared to its own SMA. When band width drops below 72% of its recent average, the market is compressing. A squeeze start fires a golden diamond marker at the trail level. A squeeze release fires a larger circle marker. The high-confidence signal fires when a squeeze release coincides with an active pressure state, identifying the highest-probability setups where compressed volatility breaks out in a confirmed directional context.
5. Three-Layer Visual Architecture
The chart renders three nested visual layers:
- Outer Cloud: The ATR envelope (cloudMult * ATR from HMA center) filled with a very transparent directional color — gives spatial context to where price is within the volatility range
- Inner Band Fill: The ratchet upper and lower bands filled with medium transparency — shows the active directional channel
- Core Pressure Fill: A gradient fill between the HMA baseline and the candle mid-body — transparent at the HMA, saturated at the body, colored by pressure state
The trail line itself uses three stacked plots at widths 10, 5, and 2 to create a neon glow shadow effect. Bar coloring uses color.from_gradient driven by MFI intensity, producing increasingly saturated candles as momentum builds.
Features
- HMA Ratchet Trail with Triple-Layer Glow: Direction-persistent adaptive trail rendered as a neon glow (widths 10/5/2) using the bullish lime or bearish fuchsia color
- Outer ATR Volatility Cloud: Wide ATR envelope filled directionally, providing spatial context at a glance
- Inner Ratchet Band Fill: Gradient-filled active channel between upper and lower ratchet bands
- Core Pressure Gradient: Background-to-body gradient between HMA and mid-body, colored by current pressure state
- HMA Skeleton Reference: Subtle neutral line showing the raw HMA baseline beneath all fills
- Volatility Squeeze Markers: Golden diamonds during compression, circle flash on breakout
- High-Confidence Signal: Starred HC LONG / HC SHORT labels when squeeze releases into confirmed pressure alignment — the highest-quality setup the system produces
- Volume Impulse Labels: When a strong directional candle exceeds the volume threshold, a label shows the volume ratio (e.g., 2.1x vol) at the bar
- MFI Cross Markers: Small triangles on the trail when MFI crosses the 50 level, marking momentum regime shifts
- TP Signals: Labeled plotshapes when MFI reaches overbought/oversold extremes in the trail direction
- Pressure Strength Percentage: Rolling 50-bar % of time spent in active pressure — distinguishes sustained trends from brief spikes
- Gradient Bar Coloring: color.from_gradient driven by MFI intensity — bars saturate as momentum builds and fade as it weakens
- 11-Row Dashboard: Pressure state, trail direction, MFI reading, pressure score, pressure strength %, volatility state, band width, trend bars, trail price, ATR
Input Parameters
Adaptive Trail:
- Trail HMA Length: Period for the HMA baseline (default 21)
- Trail ATR Multiplier: Width of inner ratchet bands (default 1.8)
- Trail ATR Length: ATR lookback for band calculation (default 14)
- Outer Cloud ATR Width: Outer envelope width multiplier (default 3.2)
- Squeeze Reference Bars: SMA period for band-width baseline (default 20)
Pressure Filter:
- MFI Length: Volume-weighted money flow lookback (default 14)
- MFI Smoothing: HMA smoothing on raw MFI (default 7)
- MFI Bull/Bear Thresholds: Activation levels for pressure states (default 62/38)
Signals:
- TP Overbought/Oversold Levels: MFI levels that trigger TP signals (default 78/22)
- Impulse Volume Multiplier: Volume multiple above SMA required for impulse label (default 1.3)
Visuals:
- Toggles for entry signals, TP signals, glow, cloud, pressure fill, squeeze markers, and dashboard
- Bull Color (default lime #a3e635), Bear Color (default fuchsia #e879f9), Neutral Color (default slate #94a3b8)
How to Use This Indicator
Primary Setup — Trend Following with Pressure Confirmation:
Look for the trail to flip direction (circle marker on trail). Wait for MFI to cross the bull or bear threshold, confirming the pressure state activates. Enter in the trail direction once the pressure fill color saturates. Trail your stop at the active trail line. Exit on a TP signal or when the pressure state deactivates.
High-Confidence Setup:
Wait for squeeze markers (golden diamonds) to appear, indicating compression. When the squeeze releases (larger circle flash) and the pressure state is simultaneously active, the HC LONG or HC SHORT label fires. These are the setups where compressed volatility breaks out with momentum behind it.
Filtering with Pressure Strength:
The dashboard Pressure Strength percentage tells you how sustained the current move has been. Values above 60% indicate a mature trend. Values below 30% indicate the pressure state is new or unstable. Adjust position sizing accordingly.
Reading Impulse Candles:
Volume impulse labels (e.g., "2.1x vol") mark bars where a strong directional move was accompanied by significantly elevated volume. These often mark the start or acceleration of a pressure phase and can serve as reference points for support/resistance.
APT dashboard showing bull pressure active, MFI at 71.2, P-Score 7.1/10, P-Strength at 64%, band width expanding after a squeeze release, and the trail at current price with ATR reference
Indicator Limitations
- The ratchet trail requires a confirmed close through the active band to flip direction. On higher-timeframe charts with large candle bodies this can mean the flip is confirmed well after the actual turning point
- The volume-weighted MFI requires volume data. On instruments with unreliable volume reporting (some forex pairs, synthetic indices) the pressure filter may be less meaningful than on equities or futures
- Squeeze detection uses a 72% band-width threshold. In persistently low-volatility instruments this threshold may trigger too frequently; adjusting the Squeeze Reference Bars parameter can help
- High-confidence signals require both a squeeze release and active pressure simultaneously. On trending markets with no compression phase, HC signals will be rare
- MFI thresholds at 62/38 are defaults designed for balanced use; highly trending instruments may require raising the bull threshold and lowering the bear threshold to reduce false pressure activations
Originality Statement
This indicator is original in its combination of a ratchet-constrained HMA trail with a custom volume-weighted MFI, the three-layer nested visual system, and the squeeze-breakout confluence signal. While HMA trails and MFI oscillators exist independently, this publication is justified because:
- The ratchet logic applied to HMA (rather than ATR midline or EMA) reduces lag while preventing the constant flipping common in standard trail indicators
- The custom volume-weighted MFI differs from the standard MFI by using HLC3 as the price component with RSI-formula normalization, producing a smoother measure with better noise rejection
- The three-layer nested fill architecture (outer cloud, inner band, core pressure gradient) provides a spatially organized visual system where the distance between layers communicates volatility context
- Squeeze detection integrated with pressure confirmation for HC signals is a novel combination that identifies setups at the intersection of volatility compression and momentum alignment
- The Pressure Strength rolling percentage provides a trend maturity measure not present in standard trail indicators
Disclaimer
This indicator is provided for educational and informational purposes only and does not constitute financial advice or a recommendation to buy or sell any financial instrument. Past performance of any pattern or signal does not guarantee future results. All trading involves substantial risk. Always use proper risk management and conduct your own independent analysis.
— Made with passion by officialjackofalltrades
Open-source script
In true TradingView spirit, the creator of this script has made it open-source, so that traders can review and verify its functionality. Kudos to the author! While you can use it for free, remember that republishing the code is subject to our House Rules.

The Institutional Grade Trading Ecosystem, Built to win trades 📈
Get Access 👇
jackofalltrades.vip 🌐
t.me/jackofalltradesvip 🃏
Get Access 👇
jackofalltrades.vip 🌐
t.me/jackofalltradesvip 🃏
Disclaimer
The information and publications are not meant to be, and do not constitute, financial, investment, trading, or other types of advice or recommendations supplied or endorsed by TradingView. Read more in the Terms of Use.
Open-source script
In true TradingView spirit, the creator of this script has made it open-source, so that traders can review and verify its functionality. Kudos to the author! While you can use it for free, remember that republishing the code is subject to our House Rules.
The Institutional Grade Trading Ecosystem, Built to win trades 📈
Get Access 👇
jackofalltrades.vip 🌐
t.me/jackofalltradesvip 🃏
Get Access 👇
jackofalltrades.vip 🌐
t.me/jackofalltradesvip 🃏
Disclaimer
The information and publications are not meant to be, and do not constitute, financial, investment, trading, or other types of advice or recommendations supplied or endorsed by TradingView. Read more in the Terms of Use.