OPEN-SOURCE SCRIPT
Updated Kale Dashboard
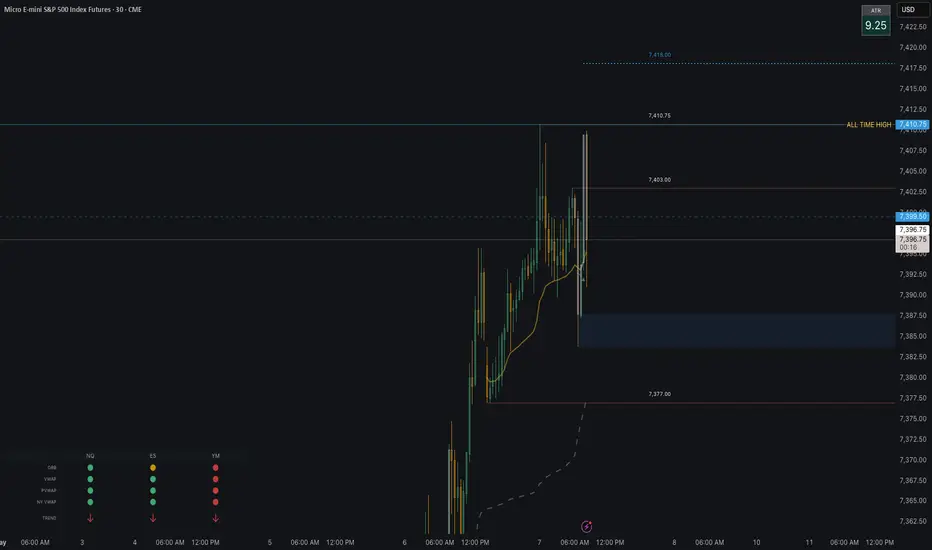
a dashboard on your chart showing gold, nasdaq, spy, meta, apple, nividia and YM. it shows whether they are above or below the 15m orb
Release Notes
shows the orb for top instruments. gives you an idea of trend for the dayRelease Notes
Dashboard showing the instruments that coordinate. The top row shows when that instrument is either above below or in the 15M session ORB. The middle row show whether is it above or below its session vwap. The last row shows what the trend is doing using the 5M chart for reference. Release Notes
You now have options to include or take away an instrument and choose the color of the table. last but not least, more location options of the box. Release Notes
you can now change the color of everything. i have also included more instruments and location options. Open-source script
In true TradingView spirit, the creator of this script has made it open-source, so that traders can review and verify its functionality. Kudos to the author! While you can use it for free, remember that republishing the code is subject to our House Rules.

Disclaimer
The information and publications are not meant to be, and do not constitute, financial, investment, trading, or other types of advice or recommendations supplied or endorsed by TradingView. Read more in the Terms of Use.
Open-source script
In true TradingView spirit, the creator of this script has made it open-source, so that traders can review and verify its functionality. Kudos to the author! While you can use it for free, remember that republishing the code is subject to our House Rules.
Disclaimer
The information and publications are not meant to be, and do not constitute, financial, investment, trading, or other types of advice or recommendations supplied or endorsed by TradingView. Read more in the Terms of Use.