OPEN-SOURCE SCRIPT
RichmondHillCM - BTC Power Law - Log Price Linear Time
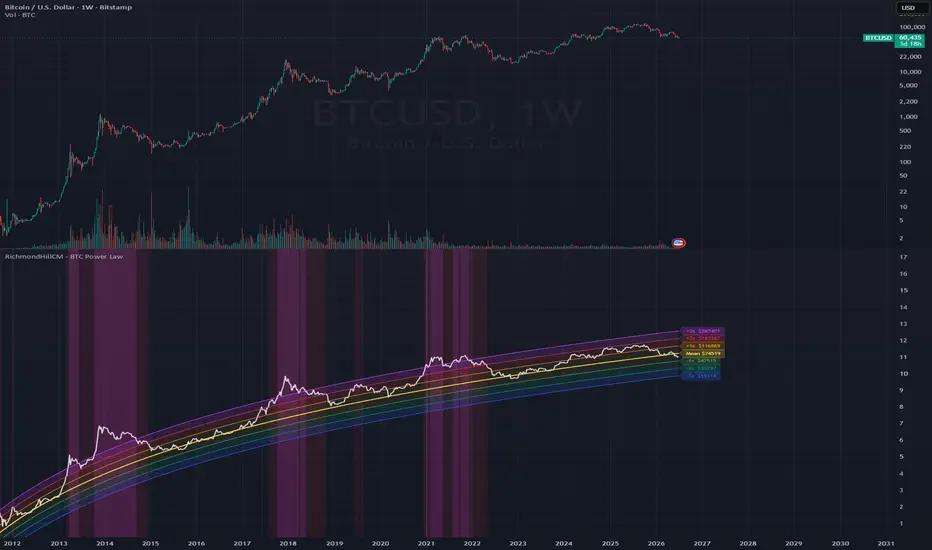
Bitcoin Power Law
The bands are plotted as ln(price) values in a separate pane.
On this pane the power-law mean and all sigma bands appear as
perfectly straight lines, because ln(price) = A*ln(days)+B is
linear in ln(days) -- but we plot against bar_index (linear time)
so the lines curve gently, correctly showing the power-law shape.
HOW TO USE:
1. Add this indicator to BTCUSD (any timeframe, weekly recommended)
2. It opens in its OWN pane below the main chart -- do NOT overlay
3. The pane Y-axis is ln(price) -- read the labels for USD levels
4. No log-scale toggle needed: the pane is already in log-price space
Genesis block: 3 January 2009 00:00 UTC
The bands are plotted as ln(price) values in a separate pane.
On this pane the power-law mean and all sigma bands appear as
perfectly straight lines, because ln(price) = A*ln(days)+B is
linear in ln(days) -- but we plot against bar_index (linear time)
so the lines curve gently, correctly showing the power-law shape.
HOW TO USE:
1. Add this indicator to BTCUSD (any timeframe, weekly recommended)
2. It opens in its OWN pane below the main chart -- do NOT overlay
3. The pane Y-axis is ln(price) -- read the labels for USD levels
4. No log-scale toggle needed: the pane is already in log-price space
Genesis block: 3 January 2009 00:00 UTC
Open-source script
In true TradingView spirit, the creator of this script has made it open-source, so that traders can review and verify its functionality. Kudos to the author! While you can use it for free, remember that republishing the code is subject to our House Rules.

Disclaimer
The information and publications are not meant to be, and do not constitute, financial, investment, trading, or other types of advice or recommendations supplied or endorsed by TradingView. Read more in the Terms of Use.
Open-source script
In true TradingView spirit, the creator of this script has made it open-source, so that traders can review and verify its functionality. Kudos to the author! While you can use it for free, remember that republishing the code is subject to our House Rules.
Disclaimer
The information and publications are not meant to be, and do not constitute, financial, investment, trading, or other types of advice or recommendations supplied or endorsed by TradingView. Read more in the Terms of Use.