NY Session Map: Initial Balance + Liquidity Sweeps [Aurabot]
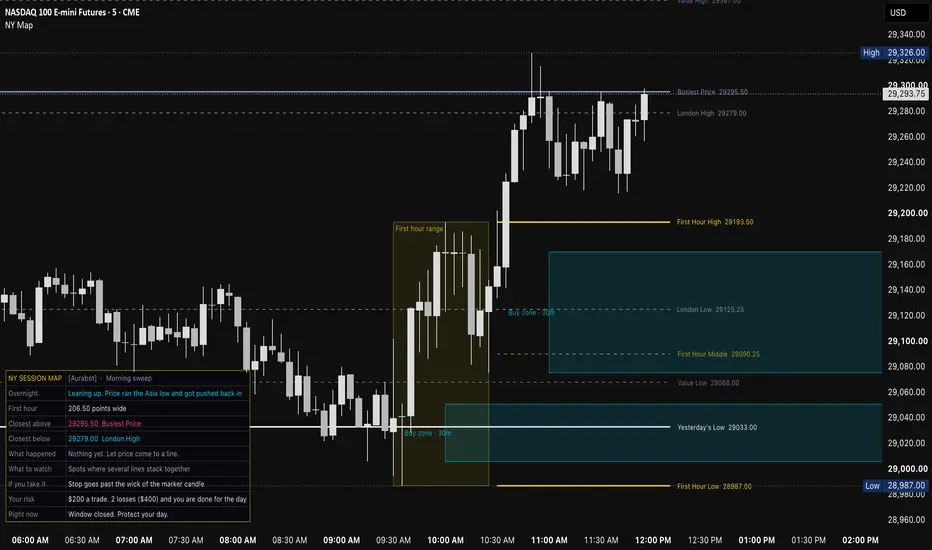
NY Session Map puts the lines most New York session traders draw by hand on the chart for you, names them in plain English, and explains what price is doing in a small panel. It is built for NQ and Gold but works on any futures or index chart on an intraday timeframe.
WHAT IT DRAWS
Yesterday's High and Low. Yesterday's value area: Value High, Busiest Price (the price with the most volume) and Value Low. Last week's value area. The London High and Low (2 to 5 AM ET). The Asia range (6 to 8 PM ET). The First Hour range (the Initial Balance, 9:30 to 10:30 ET) with its high, middle and low. Recent 30 minute buy and sell zones, which are the last candle before a big 30 minute move.
Every line is a straight line with its name parked just right of the latest candle, so the candles stay clean. Zone and range names sit inside their boxes. Lines far from price are skipped so the chart keeps a useful scale.
WATCH SPOTS
Two styles, pick one in the settings.
Morning sweep (default): from 9:40 to 10:30 ET, a small tag appears when price runs the Asia or overnight high or low and closes back inside. Max 2 a day.
First hour playbook: after 10:30 ET, a tag appears on a failed breakout of the first hour range, or when a trending day pulls back to the first hour middle and holds.
A watch spot is a place to look, not a signal. In our own 4 year test on NQ and Gold, taking these spots blindly did not make money after costs. They are useful as a map, and your own read of price decides the trade.
THE PANEL
Overnight lean from the Asia range, how wide the first hour was (and whether it was narrow), the closest line above and below price, what just happened and what to watch, where a stop would go and how many contracts or micros fit your dollar risk, and a reminder of your daily loss limit. A Right Now row flags the choppy open, lunch, news minutes and the last hour.
SETTINGS
16 color themes plus Custom, text size, panel position, and a Past days option (0 keeps only today, raise it to review earlier days). Every session time, the value area %, the zone size and the risk numbers can be changed. Alerts are included for new watch spots and for price touching the Asia range.
NOTES
Times are New York time. Volume profile levels need a chart of 30 minutes or less. Educational tool only, not financial advice.
WHAT IT DRAWS
Yesterday's High and Low. Yesterday's value area: Value High, Busiest Price (the price with the most volume) and Value Low. Last week's value area. The London High and Low (2 to 5 AM ET). The Asia range (6 to 8 PM ET). The First Hour range (the Initial Balance, 9:30 to 10:30 ET) with its high, middle and low. Recent 30 minute buy and sell zones, which are the last candle before a big 30 minute move.
Every line is a straight line with its name parked just right of the latest candle, so the candles stay clean. Zone and range names sit inside their boxes. Lines far from price are skipped so the chart keeps a useful scale.
WATCH SPOTS
Two styles, pick one in the settings.
Morning sweep (default): from 9:40 to 10:30 ET, a small tag appears when price runs the Asia or overnight high or low and closes back inside. Max 2 a day.
First hour playbook: after 10:30 ET, a tag appears on a failed breakout of the first hour range, or when a trending day pulls back to the first hour middle and holds.
A watch spot is a place to look, not a signal. In our own 4 year test on NQ and Gold, taking these spots blindly did not make money after costs. They are useful as a map, and your own read of price decides the trade.
THE PANEL
Overnight lean from the Asia range, how wide the first hour was (and whether it was narrow), the closest line above and below price, what just happened and what to watch, where a stop would go and how many contracts or micros fit your dollar risk, and a reminder of your daily loss limit. A Right Now row flags the choppy open, lunch, news minutes and the last hour.
SETTINGS
16 color themes plus Custom, text size, panel position, and a Past days option (0 keeps only today, raise it to review earlier days). Every session time, the value area %, the zone size and the risk numbers can be changed. Alerts are included for new watch spots and for price touching the Asia range.
NOTES
Times are New York time. Volume profile levels need a chart of 30 minutes or less. Educational tool only, not financial advice.

AURΔBØT™ — trading systems and tools for NQ, MNQ and Gold. aurabotofficial.com
Disclaimer
The information and publications are not meant to be, and do not constitute, financial, investment, trading, or other types of advice or recommendations supplied or endorsed by TradingView. Read more in the Terms of Use.
AURΔBØT™ — trading systems and tools for NQ, MNQ and Gold. aurabotofficial.com
Disclaimer
The information and publications are not meant to be, and do not constitute, financial, investment, trading, or other types of advice or recommendations supplied or endorsed by TradingView. Read more in the Terms of Use.