OPEN-SOURCE SCRIPT
Updated Aquile Reali Macro Compass
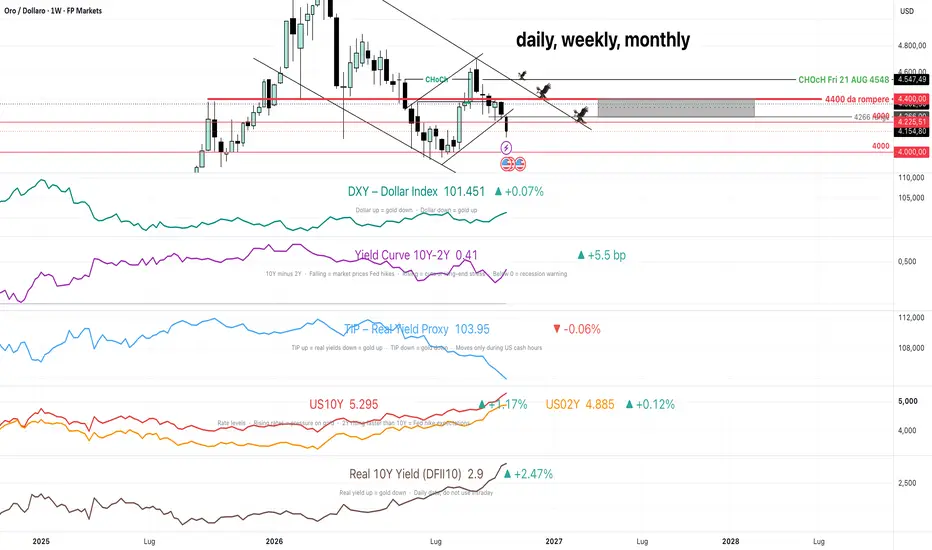
AQUILE REALI MACRO COMPASS
Available in English and Italian: switch with the "Language / Lingua" option.
Disponibile in inglese e italiano: cambia lingua con l'opzione "Language / Lingua".
WHAT IT DOES
Gold does not move alone. It reacts to the US dollar, to interest rates and, above all, to real yields. This indicator puts the main macro drivers of gold under your chart, aligned on the same time scale, and summarizes them in a single "compass" that tells you whether the macro backdrop is bullish, bearish or mixed for gold on every timeframe from 1 hour to monthly.
THE COMPASS LOGIC
The compass compares two instruments:
- TIP (iShares TIPS Bond ETF), used as a real-time proxy of US real yields. TIP up = real yields down.
- DXY, the US Dollar Index.
Rules:
- TIP up + DXY down = BULLISH gold (real yields and dollar both easing)
- TIP down + DXY up = BEARISH gold (real yields and dollar both rising)
- Any other combination = MIXED signal (the two drivers disagree, no clean macro read)
Direction is measured as the change over the last N bars (default 3, adjustable). On intraday charts the compass updates only during US cash hours, because TIP does not trade outside them.
The dashboard shows the compass state on 1H, 4H, 8H, 12H, D, W and M at the same time, so you can see immediately where timeframes agree. It reads the same on any chart timeframe.
AVAILABLE PANELS
Add the indicator once per pane and choose a different panel each time:
- DXY – Dollar Index
- Yield Curve 10Y-2Y – the spread between the 10-year and 2-year Treasury yields. A falling curve means the 2-year is rising faster than the 10-year, i.e. the market is pricing Fed hikes. Below zero = inversion.
- TIP – Real Yield Proxy
- US10Y + US02Y – both yields in one pane, to see which one moves faster
- WTI Crude Oil – continuous contract, as oil feeds inflation expectations and yields
- DFII10 – the official 10-year real yield (daily data only, not suitable for intraday)
- Custom – any symbol, as a single line, two lines or a spread
Each panel shows a large label with the symbol name and last value, in the color of its line, plus a short description of how to read it (can be hidden).
LANGUAGE
On-chart text (titles, descriptions, compass and alert messages) is available in English or Italian: choose it with the "Language / Lingua" option. Settings menus are in English.
HOW TO SET IT UP
1. Open a gold chart (futures or spot).
2. Add the indicator five times and select DXY, Yield Curve 10Y-2Y, TIP, US10Y + US02Y and WTI Crude Oil.
3. In ONE pane only (for example DXY), enable "This is the main panel". The compass line and the multi-timeframe dashboard appear there, and that pane sends the alerts.
4. Save the layout.
ALERTS
Create one alert on the indicator with the condition "Any alert() function call". It covers:
- Compass state changes. With the higher-trend filter enabled (default: weekly), you are notified only when the signal on your chart timeframe agrees with the higher trend, plus whenever the higher trend itself changes.
- Sharp moves in the 2-year yield (default 10 basis points in one bar), typical after inflation and jobs data.
- The 10Y-2Y yield curve crossing zero.
- Price levels on DXY, US10Y, WTI and your chart symbol. The default values are the author's key levels for Micro Gold futures (MGC) at the time of publication: replace them with your own levels, or set a value to 0 to disable it.
Tip: create the alert on a 1H chart. On a weekly chart it would only trigger once a week.
TECHNICAL NOTE
Gold futures bars close at 17:00 New York time, while yield and dollar index bars run midnight to midnight. Requested on the same timeframe, the last yield bar of the week would close after the futures bar and would be skipped, showing the previous day's value. The script therefore reads a lower timeframe (4H on weekly, 1H on daily and intraday above 1H), so the values shown match the real closing values.
LIMITATIONS
- TIP is a bond ETF and only an approximation of real yields.
- The compass is a macro filter, not an entry signal. Use it to decide which direction to favor, and use your own price action for timing.
- Outside US cash hours TIP is flat, so intraday compass readings refer to the last US session.
- Intermarket relationships can weaken for periods of time, for example when geopolitical flows or central bank buying dominate.
This script is for educational purposes and is not financial advice.
──────────────
🇮🇹 ITALIANO
Lo script è disponibile anche in italiano: nelle impostazioni, alla voce "Language / Lingua", scegli "Italiano".
L'oro non si muove da solo: reagisce al dollaro, ai tassi e soprattutto ai rendimenti reali. Questo indicatore mette sotto il grafico i principali fattori macro dell'oro, allineati sulla stessa scala temporale, e li riassume in una "bussola" che indica se il quadro macro è rialzista, ribassista o misto per l'oro su ogni timeframe, dall'1 ora al mensile.
La bussola confronta TIP (proxy in tempo reale dei rendimenti reali USA) e DXY (indice del dollaro):
- TIP su + DXY giù = RIALZISTA per l'oro
- TIP giù + DXY su = RIBASSISTA per l'oro
- Qualsiasi altra combinazione = segnale MISTO, nessuna lettura pulita
Pannelli disponibili: DXY, Curva 10Y-2Y, TIP, US10Y + US02Y, WTI, DFII10 e Personalizzato. Aggiungi l'indicatore una volta per pannello e attiva "This is the main panel" in uno solo: lì compaiono la bussola multi-timeframe e partono gli alert.
Scritte sul grafico e messaggi degli alert disponibili in inglese o italiano: scegli la lingua con l'opzione "Language / Lingua". I menu delle impostazioni sono in inglese.
I livelli degli alert preimpostati sono quelli dell'autore su MGC al momento della pubblicazione: sostituiscili con i tuoi, oppure metti 0 per disattivarli.
La bussola è un filtro macro, non un segnale d'ingresso. Contenuto a scopo educativo, non è una consulenza finanziaria.
Nate per volare, nate per osare · Be Stable. Be Strong. 🦅
Available in English and Italian: switch with the "Language / Lingua" option.
Disponibile in inglese e italiano: cambia lingua con l'opzione "Language / Lingua".
WHAT IT DOES
Gold does not move alone. It reacts to the US dollar, to interest rates and, above all, to real yields. This indicator puts the main macro drivers of gold under your chart, aligned on the same time scale, and summarizes them in a single "compass" that tells you whether the macro backdrop is bullish, bearish or mixed for gold on every timeframe from 1 hour to monthly.
THE COMPASS LOGIC
The compass compares two instruments:
- TIP (iShares TIPS Bond ETF), used as a real-time proxy of US real yields. TIP up = real yields down.
- DXY, the US Dollar Index.
Rules:
- TIP up + DXY down = BULLISH gold (real yields and dollar both easing)
- TIP down + DXY up = BEARISH gold (real yields and dollar both rising)
- Any other combination = MIXED signal (the two drivers disagree, no clean macro read)
Direction is measured as the change over the last N bars (default 3, adjustable). On intraday charts the compass updates only during US cash hours, because TIP does not trade outside them.
The dashboard shows the compass state on 1H, 4H, 8H, 12H, D, W and M at the same time, so you can see immediately where timeframes agree. It reads the same on any chart timeframe.
AVAILABLE PANELS
Add the indicator once per pane and choose a different panel each time:
- DXY – Dollar Index
- Yield Curve 10Y-2Y – the spread between the 10-year and 2-year Treasury yields. A falling curve means the 2-year is rising faster than the 10-year, i.e. the market is pricing Fed hikes. Below zero = inversion.
- TIP – Real Yield Proxy
- US10Y + US02Y – both yields in one pane, to see which one moves faster
- WTI Crude Oil – continuous contract, as oil feeds inflation expectations and yields
- DFII10 – the official 10-year real yield (daily data only, not suitable for intraday)
- Custom – any symbol, as a single line, two lines or a spread
Each panel shows a large label with the symbol name and last value, in the color of its line, plus a short description of how to read it (can be hidden).
LANGUAGE
On-chart text (titles, descriptions, compass and alert messages) is available in English or Italian: choose it with the "Language / Lingua" option. Settings menus are in English.
HOW TO SET IT UP
1. Open a gold chart (futures or spot).
2. Add the indicator five times and select DXY, Yield Curve 10Y-2Y, TIP, US10Y + US02Y and WTI Crude Oil.
3. In ONE pane only (for example DXY), enable "This is the main panel". The compass line and the multi-timeframe dashboard appear there, and that pane sends the alerts.
4. Save the layout.
ALERTS
Create one alert on the indicator with the condition "Any alert() function call". It covers:
- Compass state changes. With the higher-trend filter enabled (default: weekly), you are notified only when the signal on your chart timeframe agrees with the higher trend, plus whenever the higher trend itself changes.
- Sharp moves in the 2-year yield (default 10 basis points in one bar), typical after inflation and jobs data.
- The 10Y-2Y yield curve crossing zero.
- Price levels on DXY, US10Y, WTI and your chart symbol. The default values are the author's key levels for Micro Gold futures (MGC) at the time of publication: replace them with your own levels, or set a value to 0 to disable it.
Tip: create the alert on a 1H chart. On a weekly chart it would only trigger once a week.
TECHNICAL NOTE
Gold futures bars close at 17:00 New York time, while yield and dollar index bars run midnight to midnight. Requested on the same timeframe, the last yield bar of the week would close after the futures bar and would be skipped, showing the previous day's value. The script therefore reads a lower timeframe (4H on weekly, 1H on daily and intraday above 1H), so the values shown match the real closing values.
LIMITATIONS
- TIP is a bond ETF and only an approximation of real yields.
- The compass is a macro filter, not an entry signal. Use it to decide which direction to favor, and use your own price action for timing.
- Outside US cash hours TIP is flat, so intraday compass readings refer to the last US session.
- Intermarket relationships can weaken for periods of time, for example when geopolitical flows or central bank buying dominate.
This script is for educational purposes and is not financial advice.
──────────────
🇮🇹 ITALIANO
Lo script è disponibile anche in italiano: nelle impostazioni, alla voce "Language / Lingua", scegli "Italiano".
L'oro non si muove da solo: reagisce al dollaro, ai tassi e soprattutto ai rendimenti reali. Questo indicatore mette sotto il grafico i principali fattori macro dell'oro, allineati sulla stessa scala temporale, e li riassume in una "bussola" che indica se il quadro macro è rialzista, ribassista o misto per l'oro su ogni timeframe, dall'1 ora al mensile.
La bussola confronta TIP (proxy in tempo reale dei rendimenti reali USA) e DXY (indice del dollaro):
- TIP su + DXY giù = RIALZISTA per l'oro
- TIP giù + DXY su = RIBASSISTA per l'oro
- Qualsiasi altra combinazione = segnale MISTO, nessuna lettura pulita
Pannelli disponibili: DXY, Curva 10Y-2Y, TIP, US10Y + US02Y, WTI, DFII10 e Personalizzato. Aggiungi l'indicatore una volta per pannello e attiva "This is the main panel" in uno solo: lì compaiono la bussola multi-timeframe e partono gli alert.
Scritte sul grafico e messaggi degli alert disponibili in inglese o italiano: scegli la lingua con l'opzione "Language / Lingua". I menu delle impostazioni sono in inglese.
I livelli degli alert preimpostati sono quelli dell'autore su MGC al momento della pubblicazione: sostituiscili con i tuoi, oppure metti 0 per disattivarli.
La bussola è un filtro macro, non un segnale d'ingresso. Contenuto a scopo educativo, non è una consulenza finanziaria.
Nate per volare, nate per osare · Be Stable. Be Strong. 🦅
Release Notes
Update:- Level alerts are now disabled by default (0). Set your own levels in the "Level alerts" group.
- US02Y sharp-move alert is now adaptive: it fires when the 2Y moves at least N times its normal per-bar move (default 2.5x, min 1 bp), so it works on any timeframe. A fixed threshold (default 10 bp) still fires regardless. The alert now says whether the move is against or supportive for gold.
- TIP closed outside US cash hours: the compass now shows when TIP reopens and the time of the last valid reading. Intraday cells (15m–12H) are faded while TIP is closed.
- Added 15m to the multi-timeframe compass row.
Release Notes
UPDATE — Daily change + DFII10 fixNEW: daily change next to every value
- Each panel now shows the change vs the previous daily close right next to the asset name and value, green when up and red when down.
- Prices, indices and yields: % change (DXY, TIP, WTI, US10Y, US02Y, DFII10, Custom).
- Spread panels (Yield Curve 10Y-2Y): change in basis points, because a % change of a spread close to zero is meaningless.
- The US10Y + US02Y panel shows a separate daily change for each yield.
- The value is the same on any chart timeframe (1m, 15m, H4, D...), always measured against the previous daily close.
- New options under "Style": show/hide the daily change and choose the up/down colors.
FIX
- DFII10 (FRED) no longer shows NaN on daily and intraday charts: FRED series only have daily data and are now requested on the daily timeframe.
Compass dashboard, alerts and all existing panels work exactly as before.
Open-source script
In true TradingView spirit, the creator of this script has made it open-source, so that traders can review and verify its functionality. Kudos to the author! While you can use it for free, remember that republishing the code is subject to our House Rules.

AQUILE REALI – Educational tools by giua64
Disclaimer
The information and publications are not meant to be, and do not constitute, financial, investment, trading, or other types of advice or recommendations supplied or endorsed by TradingView. Read more in the Terms of Use.
Open-source script
In true TradingView spirit, the creator of this script has made it open-source, so that traders can review and verify its functionality. Kudos to the author! While you can use it for free, remember that republishing the code is subject to our House Rules.
AQUILE REALI – Educational tools by giua64
Disclaimer
The information and publications are not meant to be, and do not constitute, financial, investment, trading, or other types of advice or recommendations supplied or endorsed by TradingView. Read more in the Terms of Use.