OPEN-SOURCE SCRIPT
Updated GEM Logic 1.5
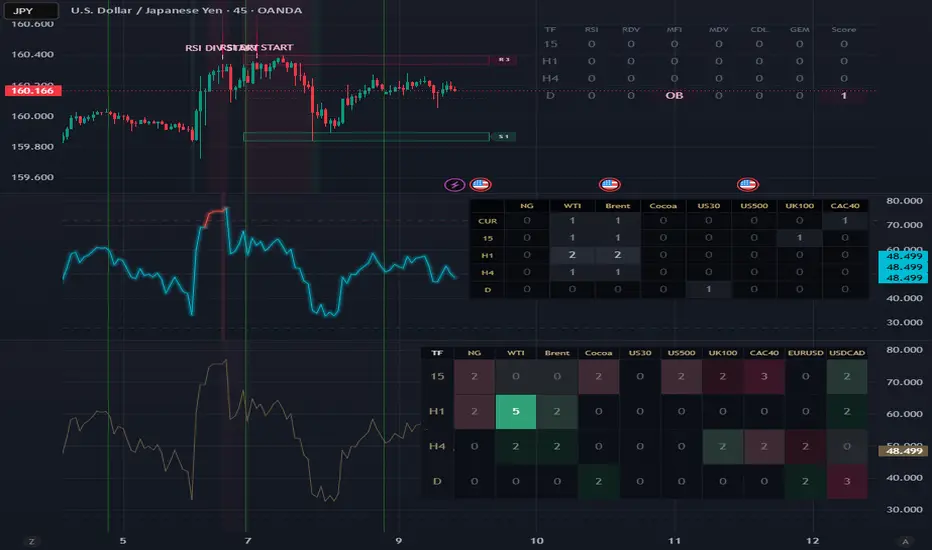
GEM Logic 1.5
GEM Logic 1.5 is a multi-layer market context indicator built to help traders quickly spot when several important signals begin to align.
Instead of relying on a single condition, this script combines RSI behavior, divergence logic, candlestick confirmation, multi-timeframe scoring, ADX, and recent range-based support/resistance zones into one clean visual framework.
The goal is simple:
show when market conditions are becoming more meaningful, not just more noisy.
What this indicator does
GEM Logic 1.5 combines several layers of analysis:
1. RSI context
The script tracks RSI and highlights when price is moving into overbought or oversold territory.
This helps identify areas where momentum may be stretched and where reversals or pauses may become more likely.
2. Divergence detection
The indicator looks for bullish and bearish RSI divergence between price and momentum.
It also tracks repeated divergence events over a lookback window, so the script can distinguish between a single weak signal and a stronger multi-event setup.
3. Execution state
Once a stronger divergence setup appears, the script monitors whether price has actually triggered an entry condition.
This gives a cleaner separation between:
a market that is only preparing
and a market that is already activating
4. Candlestick confirmation
The indicator also includes a candlestick layer using common price action patterns such as:
Engulfing
Pin bars / rejection candles
Morning / Evening Star
Inside bar breakout
Outside bar
Marubozu
These patterns act as an additional confirmation layer around momentum shifts.
5. GEM logic
The core idea of the script is the GEM concept:
A setup becomes more interesting when multiple elements begin to align at the same time, such as:
RSI extreme
divergence
candlestick confirmation
When these layers cluster together, the script can display a stronger confirmation event.
6. Multi-timeframe dashboard
The table on the right shows the current state across:
5m
15m
H1
H4
D
W
Each timeframe receives a score based on how many active factors are currently present.
This helps traders quickly see where market structure is strongest instead of manually switching charts all the time.
7. ADX reading
The bottom row displays ADX, giving a quick view of trend strength.
This helps distinguish between quieter conditions and stronger directional conditions.
8. Recent range support / resistance zones
The script also builds a recent range and marks support/resistance areas based on that range.
This provides a practical structure layer so signals can be interpreted in context rather than in isolation.
How to read the dashboard
The dashboard is designed to be simple.
Main rows
DIVERGENCE → shows whether bullish or bearish divergence is active
EXECUTION → shows whether a setup is waiting or already triggered
RSI → current RSI value
ADX → current ADX value
Timeframe score rows
The rows for 5, 15, H1, H4, D, W show how many factors are active on each timeframe.
General interpretation:
0 = no meaningful alignment
1 = one factor is active
2 = the setup is getting stronger
3+ = a more important cluster is forming
4+ = strong confluence
This score does not mean automatic buy or sell.
It simply means:
more parts of the logic are lining up on that timeframe right now.
Who this script is for
GEM Logic 1.5 may be useful for traders who want:
RSI-based context
divergence confirmation
candlestick confirmation
multi-timeframe awareness
a cleaner way to read market confluence
fewer separate indicators on the chart
It is especially helpful for traders who prefer to make decisions based on several confirming conditions, rather than reacting to one isolated signal.
Suggested workflow
A simple way to use this script:
Look at the dashboard and identify which timeframe has the strongest score.
Check whether divergence is present.
Check whether execution is still waiting or has triggered.
Look for GEM confirmation and candlestick support.
Review price location relative to the recent range zones.
Build your trade idea only after context is clear.
Important note
This script is a decision-support tool, not a prediction engine.
It does not guarantee entries, reversals, or outcomes.
It should be used together with:
risk management
position sizing
personal trade rules
market context
Nothing in this script should be treated as financial advice.
Summary
GEM Logic 1.5 is designed to help traders answer one practical question:
“Is there real confluence here, or is this just random noise?”
GEM Logic 1.5 is a multi-layer market context indicator built to help traders quickly spot when several important signals begin to align.
Instead of relying on a single condition, this script combines RSI behavior, divergence logic, candlestick confirmation, multi-timeframe scoring, ADX, and recent range-based support/resistance zones into one clean visual framework.
The goal is simple:
show when market conditions are becoming more meaningful, not just more noisy.
What this indicator does
GEM Logic 1.5 combines several layers of analysis:
1. RSI context
The script tracks RSI and highlights when price is moving into overbought or oversold territory.
This helps identify areas where momentum may be stretched and where reversals or pauses may become more likely.
2. Divergence detection
The indicator looks for bullish and bearish RSI divergence between price and momentum.
It also tracks repeated divergence events over a lookback window, so the script can distinguish between a single weak signal and a stronger multi-event setup.
3. Execution state
Once a stronger divergence setup appears, the script monitors whether price has actually triggered an entry condition.
This gives a cleaner separation between:
a market that is only preparing
and a market that is already activating
4. Candlestick confirmation
The indicator also includes a candlestick layer using common price action patterns such as:
Engulfing
Pin bars / rejection candles
Morning / Evening Star
Inside bar breakout
Outside bar
Marubozu
These patterns act as an additional confirmation layer around momentum shifts.
5. GEM logic
The core idea of the script is the GEM concept:
A setup becomes more interesting when multiple elements begin to align at the same time, such as:
RSI extreme
divergence
candlestick confirmation
When these layers cluster together, the script can display a stronger confirmation event.
6. Multi-timeframe dashboard
The table on the right shows the current state across:
5m
15m
H1
H4
D
W
Each timeframe receives a score based on how many active factors are currently present.
This helps traders quickly see where market structure is strongest instead of manually switching charts all the time.
7. ADX reading
The bottom row displays ADX, giving a quick view of trend strength.
This helps distinguish between quieter conditions and stronger directional conditions.
8. Recent range support / resistance zones
The script also builds a recent range and marks support/resistance areas based on that range.
This provides a practical structure layer so signals can be interpreted in context rather than in isolation.
How to read the dashboard
The dashboard is designed to be simple.
Main rows
DIVERGENCE → shows whether bullish or bearish divergence is active
EXECUTION → shows whether a setup is waiting or already triggered
RSI → current RSI value
ADX → current ADX value
Timeframe score rows
The rows for 5, 15, H1, H4, D, W show how many factors are active on each timeframe.
General interpretation:
0 = no meaningful alignment
1 = one factor is active
2 = the setup is getting stronger
3+ = a more important cluster is forming
4+ = strong confluence
This score does not mean automatic buy or sell.
It simply means:
more parts of the logic are lining up on that timeframe right now.
Who this script is for
GEM Logic 1.5 may be useful for traders who want:
RSI-based context
divergence confirmation
candlestick confirmation
multi-timeframe awareness
a cleaner way to read market confluence
fewer separate indicators on the chart
It is especially helpful for traders who prefer to make decisions based on several confirming conditions, rather than reacting to one isolated signal.
Suggested workflow
A simple way to use this script:
Look at the dashboard and identify which timeframe has the strongest score.
Check whether divergence is present.
Check whether execution is still waiting or has triggered.
Look for GEM confirmation and candlestick support.
Review price location relative to the recent range zones.
Build your trade idea only after context is clear.
Important note
This script is a decision-support tool, not a prediction engine.
It does not guarantee entries, reversals, or outcomes.
It should be used together with:
risk management
position sizing
personal trade rules
market context
Nothing in this script should be treated as financial advice.
Summary
GEM Logic 1.5 is designed to help traders answer one practical question:
“Is there real confluence here, or is this just random noise?”
Release Notes
GEM Logic 1.5GEM Logic 1.5 is a multi-timeframe confluence indicator built to help traders read momentum, divergence, money flow, candle confirmation, and overall setup quality in one compact dashboard.
It combines:
RSI state
RSI divergence
MFI state
MFI divergence
Candlestick confirmation
GEM setup logic
Multi-timeframe scoring
The purpose is simple:
highlight moments when multiple signals begin aligning in the same direction.
What was improved
This version expands the original logic while keeping the main GEM engine conservative and clean.
Added
Money Flow Index (MFI)
MFI divergence (MDV)
new dashboard structure:
TF | RSI | RDV | MFI | MDV | CDL | GEM | Score
Improved
cleaner visual hierarchy
less clutter
more readable multi-timeframe layout
refined Soft Glass Hybrid dashboard design
neutral states standardized as 0
Timeframes used
15m
1H
4H
1D
How it works
This indicator is a confluence tool, not a standalone entry system.
It helps answer:
Is momentum stretched?
Is price diverging from RSI?
Is money flow diverging from price?
Is there candle confirmation?
Are multiple factors aligning?
Each timeframe is evaluated separately, and the table shows whether bullish, bearish, or neutral pressure is building.
Dashboard columns
TF
Timeframe being evaluated:
15
H1
H4
D
RSI
Current RSI condition:
OS = Oversold
OB = Overbought
0 = Neutral
RDV
RSI divergence
B = Bullish
S = Bearish
0 = None
MFI
Money Flow Index
OS = Oversold
OB = Overbought
0 = Neutral
MDV
MFI divergence
B = Bullish
S = Bearish
0 = None
CDL
Candlestick confirmation
B = Bullish candle confirmation
S = Bearish candle confirmation
0 = None
GEM
Main setup signal.
In this version, GEM remains conservative and is based on:
RSI extreme
RSI divergence
candle confirmation
Values:
B = Buy GEM
S = Sell GEM
0 = No GEM
Score
Total number of active layers on that timeframe.
Score includes:
RSI
RDV
MFI
MDV
CDL
GEM
Maximum score = 6
Higher score means stronger confluence, not automatic entry.
How to use it
For beginners
Use the table as a checklist.
OS + B values + bullish GEM = bullish context
OB + S values + bearish GEM = bearish context
many 0 values = weak or incomplete setup
Do not rely on one column alone.
The script becomes stronger when several layers align together.
For experienced traders
A practical workflow:
Start with H4 and D for higher-timeframe bias
Use H1 for structure alignment
Use 15m for timing and refinement
Treat GEM as the main event signal
Use Score as confluence strength, not as a trigger by itself
Practical meaning
Bullish example
If a row shows:
RSI = OS
RDV = B
MFI = OS
MDV = B
CDL = B
GEM = B
Score = 6
that means the timeframe is showing strong bullish confluence.
Bearish example
If a row shows:
RSI = OB
RDV = S
MFI = OB
MDV = S
CDL = S
GEM = S
Score = 6
that means the timeframe is showing strong bearish confluence.
Best use cases
This script is useful for:
multi-timeframe trading
divergence analysis
reversal monitoring
pullback analysis
confluence-based setups
filtering weak signals
Important note
This is not:
a guaranteed entry system
a replacement for market structure
a substitute for risk management
It is a decision-support indicator.
Use it together with:
trend structure
support/resistance
key levels
liquidity context
proper risk management
Release Notes — v1.5
Added MFI
Added MFI divergence (MDV)
Rebuilt dashboard into:
TF | RSI | RDV | MFI | MDV | CDL | GEM | Score
Kept GEM logic conservative
Reduced clutter and improved readability
Limited timeframe set to:
15m
1H
4H
1D
Added refined Soft Glass Hybrid dashboard styling
Standardized neutral states as 0
Open-source script
In true TradingView spirit, the creator of this script has made it open-source, so that traders can review and verify its functionality. Kudos to the author! While you can use it for free, remember that republishing the code is subject to our House Rules.

Disclaimer
The information and publications are not meant to be, and do not constitute, financial, investment, trading, or other types of advice or recommendations supplied or endorsed by TradingView. Read more in the Terms of Use.
Open-source script
In true TradingView spirit, the creator of this script has made it open-source, so that traders can review and verify its functionality. Kudos to the author! While you can use it for free, remember that republishing the code is subject to our House Rules.
Disclaimer
The information and publications are not meant to be, and do not constitute, financial, investment, trading, or other types of advice or recommendations supplied or endorsed by TradingView. Read more in the Terms of Use.