OPEN-SOURCE SCRIPT
Updated Fibonacci Retracement Statistics by VolProfex
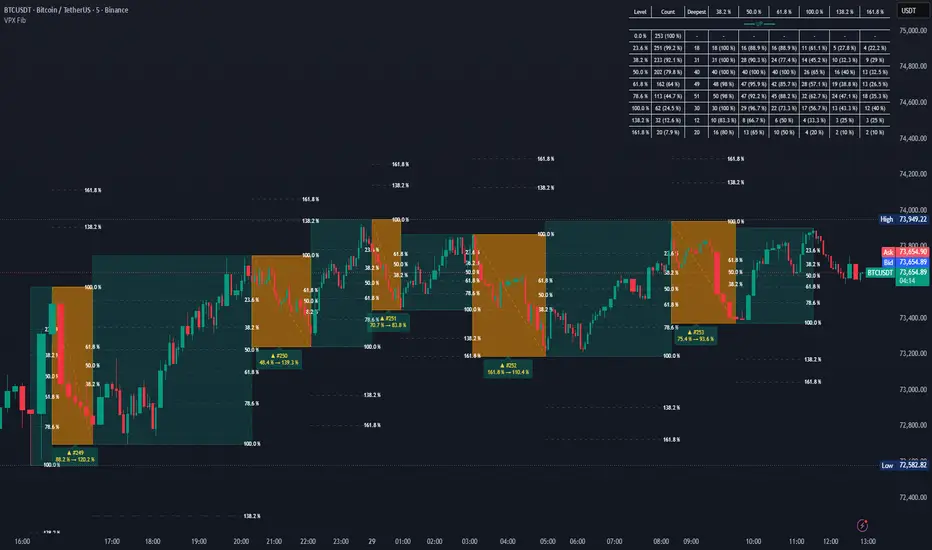
FIBONACCI RETRACEMENT STATISTICS BY VOLPROFEX
=============================================
DESCRIPTION
-----------
Fibonacci Retracement Statistics is an analysis tool that
automatically detects price swings, tracks retracements within each trend,
and calculates how often price retraces to various Fibonacci levels. The
indicator labels every completed swing with its swing number and deepest
fib level reached (e.g. "▲ #12 78.6%"), and displays a statistics table
showing the count and percentage of swings reaching each level.
All visual elements (trend boxes, fib lines, retracement boxes, labels, and
the statistics table) are drawn only on the last chart bar, keeping the
indicator performant during real-time scrolling. Retracement labels update
in real time so you always see the current value for the active swing.
HOW IT WORKS
------------
1. SWING DETECTION (ATR-Deviation ZigZag)
A volatility-adaptive ZigZag engine finds pivot highs and lows. A pivot
is confirmed when price moves against the current leg by at least
ATR(period) × deviation multiplier. A minimum swing size filter discards
insignificant wiggles. A spike filter rejects reversals triggered by
bars with extreme wick-to-body ratios.
2. HIGHER-TIMEFRAME (HTF) CONTEXT (optional)
When enabled, the indicator loads data from a higher timeframe (default: 1h)
and runs the same ZigZag engine on it. Completed HTF swings are drawn as
translucent boxes on the chart. Local swings are filtered to only count
when their direction matches the HTF swing they fall inside. This removes
counter-trend noise within the larger structure.
A separate gate ("Exclude Retracements outside HTF swing") further filters
retracement contributions: only retracements where both the trend leg and
the counter-trend leg fall inside the same completed HTF box are counted
in statistics and drawn on the chart.
3. TREND & RETRACEMENT TRACKING
Alternating pivot types (high → low → high → ...) create directional
trends. For each unfinalised trend, the indicator tracks the extreme
retracement price bar by bar. When the trend completes, the retracement
percentage is calculated using the actual counter-trend leg. This value is
then compared against each enabled Fibonacci level.
4. FIBONACCI LEVEL COUNTING
A cumulative counting system tallies how many trends have retraced to
each enabled level. Levels available include: 23.6%, 38.2%, 50.0%, 61.8%,
78.6%, 88.6%, 100.0%, 127.2%, 138.2%, 150.0%, 161.8%, plus up to 5
custom levels (0–500%). The statistics table is split into UP and DOWN
sections, each with its own Level / Count / Percent columns.
5. INTRADAY TIME WINDOW (optional)
On intraday charts, you can set a session window (e.g. 09:30–16:00) to
restrict which swings are analysed. Choose between "Pivot Confirmed Inside"
(the confirming bar's timestamp must fall in the window) or "Full Cycle
Inside" (both the pivot start and confirmation must fall in the window).
A visual box overlay can be enabled to highlight the active window.
6. SPIKE FILTER
Optionally discard ZigZag reversals triggered by bars where the upper or
lower wick exceeds the body by a user-defined ratio. This helps avoid
false pivot signals from sudden, low-liquidity spikes.
SETTINGS REFERENCE (defaults optimised for BTCUSDT, 5m chart, 1h HTF)
---------------------------------------------------------------------
── SWING ENGINE ──
- ATR Period: 14
Period for ATR calculations. Shared by local ZigZag and HTF swing detection.
- ZigZag Deviation Multiplier (ATR ×): 3.0
Pivot confirmed when price reverses by ATR × this value.
- Min Swing Size (ATR multiple): 0.8
Legs smaller than ATR × this are discarded. Set 0 to disable.
── HTF CONTEXT ──
- Use Higher Timeframe Swing Context: ON
When enabled, local swings are counted only when their direction matches the
current HTF swing bias.
- HTF Timeframe: 60
Higher timeframe for context. Must be higher than the chart timeframe.
- HTF Swing Deviation (ATR ×): 3.5
ATR multiplier for HTF pivot reversals.
- HTF Min Swing Size (ATR ×): 1.5
Minimum leg size for HTF swings. Set 0 to disable.
- Exclude Retracements outside HTF swing: ON
When enabled, only retracements fully contained within a completed HTF swing
box contribute to statistics and visual output.
- Show HTF Swings: ON
Draws HTF major swing boxes on the chart (Blue = upswing, Red = downswing).
- HTF Bull Color / HTF Bear Color: Blue (50% transp) / Red (50% transp)
── FIBONACCI LEVELS ──
- Levels enabled by default: 23.6%, 38.2%, 50.0%, 61.8%, 78.6%, 100.0%,
138.2%, 161.8%
- 5 custom level slots, each 0.0–500.0%. Set to 0.0 to disable. Default: all 0.0
── FILTERS ──
- Trend Direction: Both
Options: Both / Uptrends Only / Downtrends Only
- Use Intraday Time Window: OFF
When ON, applies a daily clock window on intraday charts.
- Window Session: 0930-1600
- Window Mode: Pivot Confirmed Inside
Options: Pivot Confirmed Inside / Full Cycle Inside
- Window Timezone: Exchange (uses the symbol's exchange timezone)
- Show Time Window Box: OFF
Visual box highlighting the active intraday window.
- Enable Spike Filter: ON
Discard reversals triggered by spike bars.
- Max Wick-to-Body Ratio: 4.0
Threshold for spike detection (wick ≥ this × body).
── DISPLAY ──
- Show Trend Boxes: ON (Border Width: 1)
Bullish: Teal / Bearish: Maroon
- Show Fib Lines: ON (Width: 1, Style: Dashed, Color: Gray at 60% transp)
- Show Fib Labels: ON (Position: Right, Vertical: Center, Size: Small, Color: White)
- Show Retracement Boxes: ON (Color: Orange at 40% transp)
- Show Retracement Labels: ON (Position: Center, Vertical: Below, Size: Small, Color: Yellow)
- Max Trends Drawn: 50 (1–500)
── TABLE ──
- Table Position: Top Right
- Font Size: Small
VISUAL OUTPUT
-------------
1. Trend Boxes: Translucent coloured boxes spanning each completed swing leg.
2. Fib Lines & Labels: Dashed (or solid/dotted) lines at each Fibonacci level
with optional percentage labels on every completed swing.
3. Retracement Boxes: Overlay boxes on the counter-trend leg with a connecting
diagonal line, colour-coded by trend direction.
4. Retracement Labels: Labels on each retracement showing:
- Arrow direction (▲ = uptrend, ▼ = downtrend)
- Filtered swing number
- Deepest Fibonacci level reached
5. HTF Swing Boxes: Larger translucent boxes showing higher-timeframe swing
structure (blue = up, red = down).
6. Statistics Table: A table in one of four corners displaying:
- Level | Count | Percent for uptrends (teal header)
- Level | Count | Percent for downtrends (maroon header)
=============================================
DESCRIPTION
-----------
Fibonacci Retracement Statistics is an analysis tool that
automatically detects price swings, tracks retracements within each trend,
and calculates how often price retraces to various Fibonacci levels. The
indicator labels every completed swing with its swing number and deepest
fib level reached (e.g. "▲ #12 78.6%"), and displays a statistics table
showing the count and percentage of swings reaching each level.
All visual elements (trend boxes, fib lines, retracement boxes, labels, and
the statistics table) are drawn only on the last chart bar, keeping the
indicator performant during real-time scrolling. Retracement labels update
in real time so you always see the current value for the active swing.
HOW IT WORKS
------------
1. SWING DETECTION (ATR-Deviation ZigZag)
A volatility-adaptive ZigZag engine finds pivot highs and lows. A pivot
is confirmed when price moves against the current leg by at least
ATR(period) × deviation multiplier. A minimum swing size filter discards
insignificant wiggles. A spike filter rejects reversals triggered by
bars with extreme wick-to-body ratios.
2. HIGHER-TIMEFRAME (HTF) CONTEXT (optional)
When enabled, the indicator loads data from a higher timeframe (default: 1h)
and runs the same ZigZag engine on it. Completed HTF swings are drawn as
translucent boxes on the chart. Local swings are filtered to only count
when their direction matches the HTF swing they fall inside. This removes
counter-trend noise within the larger structure.
A separate gate ("Exclude Retracements outside HTF swing") further filters
retracement contributions: only retracements where both the trend leg and
the counter-trend leg fall inside the same completed HTF box are counted
in statistics and drawn on the chart.
3. TREND & RETRACEMENT TRACKING
Alternating pivot types (high → low → high → ...) create directional
trends. For each unfinalised trend, the indicator tracks the extreme
retracement price bar by bar. When the trend completes, the retracement
percentage is calculated using the actual counter-trend leg. This value is
then compared against each enabled Fibonacci level.
4. FIBONACCI LEVEL COUNTING
A cumulative counting system tallies how many trends have retraced to
each enabled level. Levels available include: 23.6%, 38.2%, 50.0%, 61.8%,
78.6%, 88.6%, 100.0%, 127.2%, 138.2%, 150.0%, 161.8%, plus up to 5
custom levels (0–500%). The statistics table is split into UP and DOWN
sections, each with its own Level / Count / Percent columns.
5. INTRADAY TIME WINDOW (optional)
On intraday charts, you can set a session window (e.g. 09:30–16:00) to
restrict which swings are analysed. Choose between "Pivot Confirmed Inside"
(the confirming bar's timestamp must fall in the window) or "Full Cycle
Inside" (both the pivot start and confirmation must fall in the window).
A visual box overlay can be enabled to highlight the active window.
6. SPIKE FILTER
Optionally discard ZigZag reversals triggered by bars where the upper or
lower wick exceeds the body by a user-defined ratio. This helps avoid
false pivot signals from sudden, low-liquidity spikes.
SETTINGS REFERENCE (defaults optimised for BTCUSDT, 5m chart, 1h HTF)
---------------------------------------------------------------------
── SWING ENGINE ──
- ATR Period: 14
Period for ATR calculations. Shared by local ZigZag and HTF swing detection.
- ZigZag Deviation Multiplier (ATR ×): 3.0
Pivot confirmed when price reverses by ATR × this value.
- Min Swing Size (ATR multiple): 0.8
Legs smaller than ATR × this are discarded. Set 0 to disable.
── HTF CONTEXT ──
- Use Higher Timeframe Swing Context: ON
When enabled, local swings are counted only when their direction matches the
current HTF swing bias.
- HTF Timeframe: 60
Higher timeframe for context. Must be higher than the chart timeframe.
- HTF Swing Deviation (ATR ×): 3.5
ATR multiplier for HTF pivot reversals.
- HTF Min Swing Size (ATR ×): 1.5
Minimum leg size for HTF swings. Set 0 to disable.
- Exclude Retracements outside HTF swing: ON
When enabled, only retracements fully contained within a completed HTF swing
box contribute to statistics and visual output.
- Show HTF Swings: ON
Draws HTF major swing boxes on the chart (Blue = upswing, Red = downswing).
- HTF Bull Color / HTF Bear Color: Blue (50% transp) / Red (50% transp)
── FIBONACCI LEVELS ──
- Levels enabled by default: 23.6%, 38.2%, 50.0%, 61.8%, 78.6%, 100.0%,
138.2%, 161.8%
- 5 custom level slots, each 0.0–500.0%. Set to 0.0 to disable. Default: all 0.0
── FILTERS ──
- Trend Direction: Both
Options: Both / Uptrends Only / Downtrends Only
- Use Intraday Time Window: OFF
When ON, applies a daily clock window on intraday charts.
- Window Session: 0930-1600
- Window Mode: Pivot Confirmed Inside
Options: Pivot Confirmed Inside / Full Cycle Inside
- Window Timezone: Exchange (uses the symbol's exchange timezone)
- Show Time Window Box: OFF
Visual box highlighting the active intraday window.
- Enable Spike Filter: ON
Discard reversals triggered by spike bars.
- Max Wick-to-Body Ratio: 4.0
Threshold for spike detection (wick ≥ this × body).
── DISPLAY ──
- Show Trend Boxes: ON (Border Width: 1)
Bullish: Teal / Bearish: Maroon
- Show Fib Lines: ON (Width: 1, Style: Dashed, Color: Gray at 60% transp)
- Show Fib Labels: ON (Position: Right, Vertical: Center, Size: Small, Color: White)
- Show Retracement Boxes: ON (Color: Orange at 40% transp)
- Show Retracement Labels: ON (Position: Center, Vertical: Below, Size: Small, Color: Yellow)
- Max Trends Drawn: 50 (1–500)
── TABLE ──
- Table Position: Top Right
- Font Size: Small
VISUAL OUTPUT
-------------
1. Trend Boxes: Translucent coloured boxes spanning each completed swing leg.
2. Fib Lines & Labels: Dashed (or solid/dotted) lines at each Fibonacci level
with optional percentage labels on every completed swing.
3. Retracement Boxes: Overlay boxes on the counter-trend leg with a connecting
diagonal line, colour-coded by trend direction.
4. Retracement Labels: Labels on each retracement showing:
- Arrow direction (▲ = uptrend, ▼ = downtrend)
- Filtered swing number
- Deepest Fibonacci level reached
5. HTF Swing Boxes: Larger translucent boxes showing higher-timeframe swing
structure (blue = up, red = down).
6. Statistics Table: A table in one of four corners displaying:
- Level | Count | Percent for uptrends (teal header)
- Level | Count | Percent for downtrends (maroon header)
Release Notes
Changelog: v1.0 → v1.122New Features
- Fibonacci Extension Statistics: Conditional probability matrix showing `P(extension | retracement level reached)`. Configurable extension levels (23.6%–261.8%), 4 custom extension levels, two basis modes (Primary Swing / Retracement Swing), two conditioning modes (Deepest only / Every reached level).
- Extension Lines & Labels: Visual horizontal extension lines and percentage labels projected from the retracement extreme. Configurable width, style, color, position, and font size.
- Show actual % instead of closest level: New toggle (`showActualPct`) displays the exact retracement/extension percentage on labels instead of the nearest fib level name.
- Stats Display Mode: New `tblStatsDisplay` input: choose between Count only, Percent only, or Count + Percent combined format in the statistics table.
- 261.8% Fibonacci level: Added as a built-in toggle for both retracements and extensions.
- Time Window Box as recorded intervals: Completed time window intervals are stored in a `twInterval` array and drawn inside `barstate.islast`, surviving chart re-scroll instead of being rendered live per bar.
Changed
- Input groups reorganized: Flat DISPLAY group split into four visual groups: BOXES, RETRACEMENT VISUALS, EXTENSION VISUALS. HTF visual settings moved from HTF CONTEXT into BOXES. Custom levels moved from their own group into FIB RETRACEMENTS.
- Box border width range extended: Minimum changed from 1 to 0 (allows borderless boxes).
- Table structure enhanced: Fixed 3-column table (Level / Count / Percent) replaced with a dynamic layout: standard mode shows combined Count+Percent, extension mode adds a "Deepest" column and extension level columns.
- Max Trends Drawn: `maxTrendsDrawn` input (default 50) removed. All trends are now drawn unconditionally, TradingView caps at 500 anyway.
- Custom Level 5: Removed.
- Retracement label "Center" vertical position: Removed.
Open-source script
In true TradingView spirit, the creator of this script has made it open-source, so that traders can review and verify its functionality. Kudos to the author! While you can use it for free, remember that republishing the code is subject to our House Rules.

Disclaimer
The information and publications are not meant to be, and do not constitute, financial, investment, trading, or other types of advice or recommendations supplied or endorsed by TradingView. Read more in the Terms of Use.
Open-source script
In true TradingView spirit, the creator of this script has made it open-source, so that traders can review and verify its functionality. Kudos to the author! While you can use it for free, remember that republishing the code is subject to our House Rules.
Disclaimer
The information and publications are not meant to be, and do not constitute, financial, investment, trading, or other types of advice or recommendations supplied or endorsed by TradingView. Read more in the Terms of Use.