Price Action Support and resistance
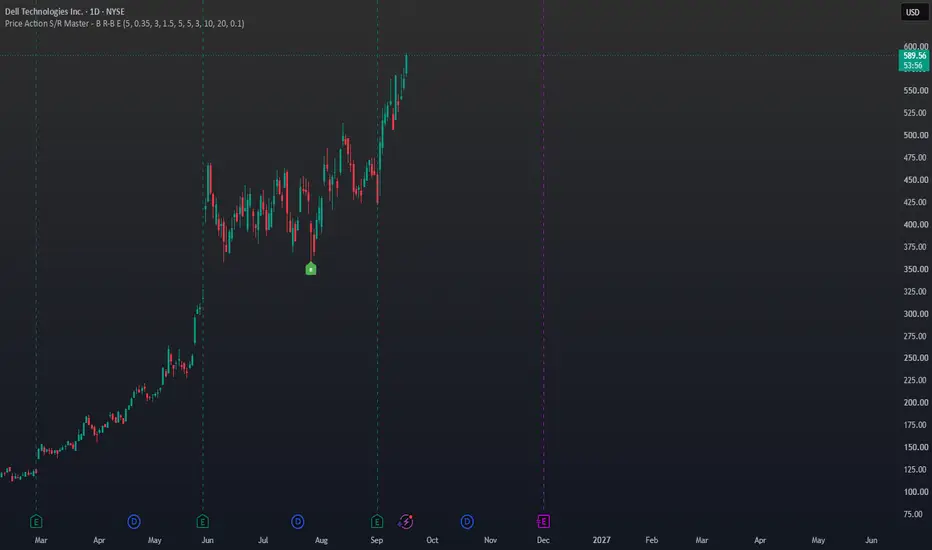
Short description
A clean daily price-action indicator that identifies support/resistance-based Buy, Re-Buy, and Exit signals using repeated S/R reactions, candle confirmation, breakout/retests, and adaptive 10-day-low protection.
Full TradingView description
Price Action S/R – Buy, Re-Buy & Exit is a price-action indicator designed primarily for daily-chart swing and positional trading.
The goal is to keep the chart visually simple while allowing the underlying logic to evaluate repeated support/resistance interactions, candle confirmation, breakout/retest setups, exits, and re-entry opportunities.
Signals
B — Buy
A Buy can occur when a sufficiently established support/resistance setup produces one of the supported bullish confirmations, including:
• Support rejection
• Bullish engulfing at support
• Support reclaim
• Resistance breakout followed by a successful retest
By default, a support/resistance level requires at least 3 touches before it becomes eligible for a signal.
R-B — Re-Buy
After an Exit, the indicator remembers the original setup level for a limited period. If price makes a fresh reclaim of that level with bullish confirmation, an R-B signal can be generated.
This is intended to identify situations where an earlier position was protected by the exit logic but the original bullish setup subsequently recovers.
E — Exit
The indicator uses two stages of downside protection.
Before a qualifying resistance warning occurs, the protective level is based on the lowest low of the previous 10 completed candles at the time of entry. This level remains frozen.
A qualifying resistance warning does not automatically create an Exit. Instead, it activates rolling previous-10-day-low protection.
After that transition, a daily close below the rolling previous 10-day low can generate an E signal.
Clean chart design
Only three markers are displayed:
B = Buy
R-B = Re-Buy
E = Exit
Additional calculations remain hidden to avoid filling the chart with support/resistance labels and warning markers.
Hovering over a signal provides additional context such as the setup type, support/resistance touch count, candle type, daily volume, RVOL20, and signal price.
Support and resistance
Support and resistance are treated as zones rather than exact prices. ATR is used to provide tolerance around detected pivot levels.
Nearby pivot reactions can contribute to an existing level, while a minimum separation between reactions helps reduce repeated counting of nearby candles as independent touches.
Candle confirmation
The indicator recognizes price-action confirmations including:
• Bullish rejection
• Bearish rejection
• Bullish engulfing
• Bearish engulfing
• Support reclaim
• Failed breakout
• Breakout and retest
Volume information
Signal tooltips include the day's volume and RVOL20, which compares current volume with the 20-day average volume.
Volume is currently informational only. It is not a mandatory condition for generating a Buy signal.
Recommended use
The indicator was designed primarily around the 1-day timeframe for swing and positional analysis.
It should be used as one component of a broader analysis process rather than as a standalone prediction system. Market conditions, company fundamentals, liquidity, earnings, gaps, and risk tolerance can materially affect results.
Historical signals do not guarantee future performance.
This script is provided for educational and technical-analysis purposes only and is not financial advice.
Suggested TradingView tags
Use tags/categories around:
Support and Resistance, Price Action, Swing Trading, Breakout, Reversal, Volume, Relative Volume
Author's note
You can add this at the bottom:
Version 1.0
This is the first public release. The emphasis is intentionally on chart simplicity: B, R-B and E are displayed while the supporting calculations operate internally.
Future versions may refine support/resistance detection, confirmation quality, volume analysis and risk management based on testing and community feedback.
Code
Use the exact locked script we just finalized — the version titled:
Price Action S/R Master - B R-B E
I would only change its public-facing title:
//version=6
indicator(
"Price Action S/R - Buy, Re-Buy & Exit [V1.0]",
overlay=true,
max_labels_count=500)
Everything below that can remain exactly as in the locked version. Do not change the calculations before publishing V1.0.
What I would choose when publishing
For visibility, publish it as an open-source indicator if you're comfortable letting others inspect/copy the Pine code. If you want people to use it but don't want the source openly available, TradingView's available publication/access choices should be reviewed at publishing time.
For the chart screenshot, use a clean 1D chart showing at least one B → E → R-B sequence if you can find a good historical example. Keep the screenshot free of unrelated indicators so people immediately understand what your script does.
And don't market it with claims like “90% accurate,” “guaranteed profits,” “best buy/sell indicator,” etc. The strength of this script is that the rules can be explained transparently.
Before you click Publish
I would use this final package:
Title: Price Action S/R – Buy, Re-Buy & Exit [V1.0]
Visibility on chart: B / R-B / E
Timeframe: 1D primarily
Description: Use the full description above.
Screenshot: Clean daily chart demonstrating the signals.
Version: 1.0
Source: Open-source if you want this to be genuinely community-shared.
Disclaimer: Educational/technical-analysis purposes; not financial advice.
A clean daily price-action indicator that identifies support/resistance-based Buy, Re-Buy, and Exit signals using repeated S/R reactions, candle confirmation, breakout/retests, and adaptive 10-day-low protection.
Full TradingView description
Price Action S/R – Buy, Re-Buy & Exit is a price-action indicator designed primarily for daily-chart swing and positional trading.
The goal is to keep the chart visually simple while allowing the underlying logic to evaluate repeated support/resistance interactions, candle confirmation, breakout/retest setups, exits, and re-entry opportunities.
Signals
B — Buy
A Buy can occur when a sufficiently established support/resistance setup produces one of the supported bullish confirmations, including:
• Support rejection
• Bullish engulfing at support
• Support reclaim
• Resistance breakout followed by a successful retest
By default, a support/resistance level requires at least 3 touches before it becomes eligible for a signal.
R-B — Re-Buy
After an Exit, the indicator remembers the original setup level for a limited period. If price makes a fresh reclaim of that level with bullish confirmation, an R-B signal can be generated.
This is intended to identify situations where an earlier position was protected by the exit logic but the original bullish setup subsequently recovers.
E — Exit
The indicator uses two stages of downside protection.
Before a qualifying resistance warning occurs, the protective level is based on the lowest low of the previous 10 completed candles at the time of entry. This level remains frozen.
A qualifying resistance warning does not automatically create an Exit. Instead, it activates rolling previous-10-day-low protection.
After that transition, a daily close below the rolling previous 10-day low can generate an E signal.
Clean chart design
Only three markers are displayed:
B = Buy
R-B = Re-Buy
E = Exit
Additional calculations remain hidden to avoid filling the chart with support/resistance labels and warning markers.
Hovering over a signal provides additional context such as the setup type, support/resistance touch count, candle type, daily volume, RVOL20, and signal price.
Support and resistance
Support and resistance are treated as zones rather than exact prices. ATR is used to provide tolerance around detected pivot levels.
Nearby pivot reactions can contribute to an existing level, while a minimum separation between reactions helps reduce repeated counting of nearby candles as independent touches.
Candle confirmation
The indicator recognizes price-action confirmations including:
• Bullish rejection
• Bearish rejection
• Bullish engulfing
• Bearish engulfing
• Support reclaim
• Failed breakout
• Breakout and retest
Volume information
Signal tooltips include the day's volume and RVOL20, which compares current volume with the 20-day average volume.
Volume is currently informational only. It is not a mandatory condition for generating a Buy signal.
Recommended use
The indicator was designed primarily around the 1-day timeframe for swing and positional analysis.
It should be used as one component of a broader analysis process rather than as a standalone prediction system. Market conditions, company fundamentals, liquidity, earnings, gaps, and risk tolerance can materially affect results.
Historical signals do not guarantee future performance.
This script is provided for educational and technical-analysis purposes only and is not financial advice.
Suggested TradingView tags
Use tags/categories around:
Support and Resistance, Price Action, Swing Trading, Breakout, Reversal, Volume, Relative Volume
Author's note
You can add this at the bottom:
Version 1.0
This is the first public release. The emphasis is intentionally on chart simplicity: B, R-B and E are displayed while the supporting calculations operate internally.
Future versions may refine support/resistance detection, confirmation quality, volume analysis and risk management based on testing and community feedback.
Code
Use the exact locked script we just finalized — the version titled:
Price Action S/R Master - B R-B E
I would only change its public-facing title:
//version=6
indicator(
"Price Action S/R - Buy, Re-Buy & Exit [V1.0]",
overlay=true,
max_labels_count=500)
Everything below that can remain exactly as in the locked version. Do not change the calculations before publishing V1.0.
What I would choose when publishing
For visibility, publish it as an open-source indicator if you're comfortable letting others inspect/copy the Pine code. If you want people to use it but don't want the source openly available, TradingView's available publication/access choices should be reviewed at publishing time.
For the chart screenshot, use a clean 1D chart showing at least one B → E → R-B sequence if you can find a good historical example. Keep the screenshot free of unrelated indicators so people immediately understand what your script does.
And don't market it with claims like “90% accurate,” “guaranteed profits,” “best buy/sell indicator,” etc. The strength of this script is that the rules can be explained transparently.
Before you click Publish
I would use this final package:
Title: Price Action S/R – Buy, Re-Buy & Exit [V1.0]
Visibility on chart: B / R-B / E
Timeframe: 1D primarily
Description: Use the full description above.
Screenshot: Clean daily chart demonstrating the signals.
Version: 1.0
Source: Open-source if you want this to be genuinely community-shared.
Disclaimer: Educational/technical-analysis purposes; not financial advice.

Disclaimer
The information and publications are not meant to be, and do not constitute, financial, investment, trading, or other types of advice or recommendations supplied or endorsed by TradingView. Read more in the Terms of Use.
Disclaimer
The information and publications are not meant to be, and do not constitute, financial, investment, trading, or other types of advice or recommendations supplied or endorsed by TradingView. Read more in the Terms of Use.