Updated
ATR Volatility giua64
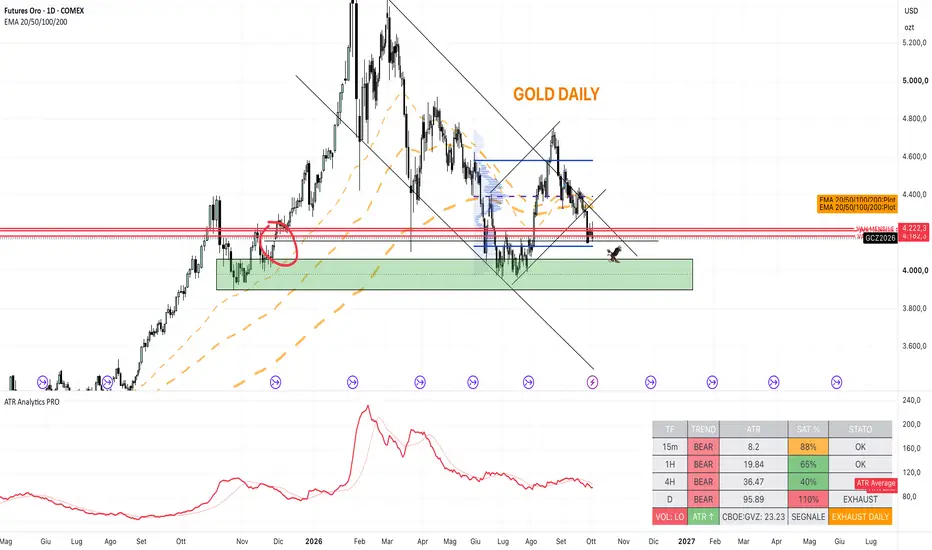
ATR Volatility giua64 – Smart Signal + VIX Filter
📘 Script Explanation (in English)
Title: ATR Volatility giua64 – Smart Signal + VIX Filter
This script analyzes market volatility using the Average True Range (ATR) and compares it to its moving average to determine whether volatility is HIGH, MEDIUM, or LOW.
It includes:
✅ Custom or preset configurations for different asset classes (Forex, Indices, Gold, etc.).
✅ An optional external volatility index input (like the VIX) to refine directional bias.
✅ A directional signal (LONG, SHORT, FLAT) based on ATR strength, direction, and external volatility conditions.
✅ A clean visual table showing key values such as ATR, ATR average, ATR %, VIX level, current range, extended range, and final signal.
This tool is ideal for traders looking to:
Monitor the intensity of price movements
Filter trading strategies based on volatility conditions
Identify momentum acceleration or exhaustion
⚙️ Settings Guide
Here’s a breakdown of the user inputs:
🔹 ATR Settings
Setting Description
ATR Length Number of periods for ATR calculation (default: 14)
ATR Smoothing Type of moving average used (RMA, SMA, EMA, WMA)
ATR Average Length Period for the ATR moving average baseline
🔹 Asset Class Preset
Choose between:
Manual – Define your own point multiplier and thresholds
Forex (Pips) – Auto-set for FX markets (high precision)
Indices (0.1 Points) – For index instruments like DAX or S&P
Gold (USD) – Preset suitable for XAU/USD
If Manual is selected, configure:
Setting Description
[Manual] Points Multiplier Multiplies raw price ranges into useful units (e.g., 10 for Gold)
[Manual] Low Volatility Threshold Threshold to define "LOW" volatility
[Manual] High Volatility Threshold Threshold to define "HIGH" volatility
🔹 Extended Range and VIX
Setting Description
Timeframe for Extended High/Low Used to compare larger price ranges (e.g., Daily or Weekly)
External Volatility Index (VIX) Symbol for a volatility index like "VIX" or "EUVI"
Low VIX Threshold Below this level, VIX is considered "low" (default: 20)
High VIX Threshold Above this level, VIX is considered "high" (default: 30)
🔹 Table Display
Setting Description
Table Position Where the visual table appears on the chart (e.g., bottom_center, top_left)
Show ATR Line on Chart Whether to display the ATR line directly on the chart
✅ Signal Logic Summary
The script determines the final signal based on:
ATR being above or below its average
ATR rising or falling
ATR percentage being significant (>2%)
VIX being high or low
Conditions Signal
ATR rising + high volatility + low VIX LONG
ATR falling + high volatility + high VIX SHORT
ATR flat or low volatility or low %ATR FLAT
📘 Script Explanation (in English)
Title: ATR Volatility giua64 – Smart Signal + VIX Filter
This script analyzes market volatility using the Average True Range (ATR) and compares it to its moving average to determine whether volatility is HIGH, MEDIUM, or LOW.
It includes:
✅ Custom or preset configurations for different asset classes (Forex, Indices, Gold, etc.).
✅ An optional external volatility index input (like the VIX) to refine directional bias.
✅ A directional signal (LONG, SHORT, FLAT) based on ATR strength, direction, and external volatility conditions.
✅ A clean visual table showing key values such as ATR, ATR average, ATR %, VIX level, current range, extended range, and final signal.
This tool is ideal for traders looking to:
Monitor the intensity of price movements
Filter trading strategies based on volatility conditions
Identify momentum acceleration or exhaustion
⚙️ Settings Guide
Here’s a breakdown of the user inputs:
🔹 ATR Settings
Setting Description
ATR Length Number of periods for ATR calculation (default: 14)
ATR Smoothing Type of moving average used (RMA, SMA, EMA, WMA)
ATR Average Length Period for the ATR moving average baseline
🔹 Asset Class Preset
Choose between:
Manual – Define your own point multiplier and thresholds
Forex (Pips) – Auto-set for FX markets (high precision)
Indices (0.1 Points) – For index instruments like DAX or S&P
Gold (USD) – Preset suitable for XAU/USD
If Manual is selected, configure:
Setting Description
[Manual] Points Multiplier Multiplies raw price ranges into useful units (e.g., 10 for Gold)
[Manual] Low Volatility Threshold Threshold to define "LOW" volatility
[Manual] High Volatility Threshold Threshold to define "HIGH" volatility
🔹 Extended Range and VIX
Setting Description
Timeframe for Extended High/Low Used to compare larger price ranges (e.g., Daily or Weekly)
External Volatility Index (VIX) Symbol for a volatility index like "VIX" or "EUVI"
Low VIX Threshold Below this level, VIX is considered "low" (default: 20)
High VIX Threshold Above this level, VIX is considered "high" (default: 30)
🔹 Table Display
Setting Description
Table Position Where the visual table appears on the chart (e.g., bottom_center, top_left)
Show ATR Line on Chart Whether to display the ATR line directly on the chart
✅ Signal Logic Summary
The script determines the final signal based on:
ATR being above or below its average
ATR rising or falling
ATR percentage being significant (>2%)
VIX being high or low
Conditions Signal
ATR rising + high volatility + low VIX LONG
ATR falling + high volatility + high VIX SHORT
ATR flat or low volatility or low %ATR FLAT
Release Notes
v8.2— Updates:Upgraded to Pine Script v6
Fixed volatility signal colors: 🟢 = high volatility (good conditions to trade), 🔴 = low volatility (wait)
Added compact/detail toggle — compact shows only: signal, ATR, VIX, Saturation%, 4H trend, Final signal
Added selectable table position (9 options)
Added table size input
Fixed 4H filter logic
Default preset changed to Gold
Improved alert conditions — specific alerts for LONG, SHORT, WARNING, EXHAUST, State Change
Release Notes
v2.1 — Bug fixes & improvements[Fix] WARN signals (WARN: FINE LONG / WARN: FINE SHORT) now correctly use the 4H trend filter (is_bull_4h) instead of the current timeframe EMA — previously the warning could trigger on a trend that the system would never have traded
[Fix] Removed trend4hShort variable that was declared but never used
[Fix] Table is now initialized as na and created only on barstate.islast, removing the unnecessary table.new(1,1) call on bar 0
[Improvement] warn_bars (number of consecutive ATR declining bars to trigger WARN) is now a configurable input (default: 3, range: 2–10)
[Improvement] exhaust_thresh default changed from 110% to 90% — more realistic for intraday XAUUSD
[New] Added ATR ↑ / ATR ↓ cell in both compact and detail table modes — green if ATR is rising, red if falling
Release Notes
ATR Analytics PRO | giua64 — v2.2 Update🐛 Bug Fix — BULL/BEAR missing in compact mode
The BULL/BEAR signal was only visible in the full detail view. Now it appears in compact mode as well.
🆕 Current TF Saturation added (Sat TF)
In addition to the Daily saturation, a real-time saturation indicator for the current timeframe is now displayed in both compact and detail views. Useful for spotting local exhaustion on lower timeframes.
🆕 VIX Timeframe now selectable
VIX was previously fixed to the Daily timeframe. You can now choose between Daily and 1H for a more reactive reading during intraday sessions.
🆕 WARN lookback rebalanced
The price lookback for WARN signals was set to 5 bars — too sensitive on fast timeframes. Now defaults to 10 bars and is fully configurable via input. Fewer false warnings on 3M and 5M charts.
📌 Usage Note
This indicator works best as a context panel, not as an entry signal for scalping on 3M/5M. Recommended use: monitor 4H:BULL/BEAR for dominant direction and ATR ↑/↓ for volatility state. For scalping entries, rely on faster tools (UT Bot, LRSI).
Amateur indicator — not financial advice.
giua64
Release Notes
Aquile Reali ATR Analytics PRO | giua64 | v4.0Overview
Aquile Reali ATR Analytics PRO v4.0 is an institutional-grade multi-timeframe dashboard and confluence indicator written in Pine Script v6 for TradingView. The engine tracks market trend structure, real-time volatility expansion, and statistical range exhaustion simultaneously across four distinct timeframes (15m, 1H, 4H, and Daily). It features an automated macro volatility filter (VIX, GVZ, EVZ) to filter directional trades and highlight overextended market conditions.
Key Features & Updates (v4.0)
Multi-Timeframe Confluence Matrix (15m, 1H, 4H, Daily): Parallel tracking of trend direction via dedicated 50 EMAs, ATR(14) values, and range saturation metrics across all four horizons.
Dynamic Range Saturation Engine (SAT %): Measures the percentage of statistical price extension consumed relative to expected ATR volatility on both intraday bars and full daily ranges.
Automated Macro Volatility Routing (AUTO Mode): Automatically routes volatility checks to the appropriate CBOE volatility index based on the chosen asset class preset:
Gold: Connects to CBOE:GVZ (Gold Volatility Index).
Forex: Connects to CBOE:EVZ (Euro Currency Volatility Index).
Indices: Connects to CBOE:VIX (S&P 500 Volatility Index).
Features a manual override input and an on/off toggle (use_vix).
Multi-Timeframe Trend Confluence: LONG and SHORT execution signals require directional trend alignment across both 1H and 4H timeframes paired with expanding ATR regimes.
Optimized UI Architecture: Upgraded to static table instantiation (var table), eliminating per-tick object recreation for minimal rendering overhead.
Dashboard Reading Guide & Legend
1. Timeframe Matrix (Rows: 15m, 1H, 4H, D)
TF (Timeframe): The specific time interval evaluated by the row (15m, 1H, 4H, Daily).
TREND: Directional bias determined by price position relative to that timeframe's 50 EMA:
BULL (Green): Price is trading above the 50 EMA.
BEAR (Red): Price is trading below the 50 EMA.
ATR: Numerical value of the 14-period Average True Range on that specific timeframe.
SAT % (Range Saturation Percentage): Percentage of consumed price movement relative to the timeframe's ATR(14):
< 70% (Green): Room for further movement within typical statistical ranges.
70% - 90% (Orange): Mature extension; standard expected range is mostly exhausted.
> 90% (Red): Overextended range; heightened risk of mean reversion or false breakouts.
STATO (Status): Operational status flag for that horizon:
OK: Volatility and range are within normal statistical bands.
SAT: Single intraday bar True Range exceeds 90% of local ATR (climax/spike bar).
EXHAUST: Daily range (High - Low) has reached or exceeded typical Daily ATR (100%+); strict risk warning against chasing moves.
2. Summary & Execution Bar (Bottom Row)
VOL: HI / VOL: LO: Volatility regime of the current chart timeframe relative to its moving average and asset multiplier (HI indicates active expansion, LO indicates compression).
ATR ↑ / ATR ↓: Trajectory of local ATR compared to the preceding bar (expanding vs. contracting volatility).
Volatility Symbol (e.g., CBOE:GVZ, CBOE:VIX): Live reading of the external implied volatility index (displays VOL EXT: OFF if disabled).
SEGNALE (Signal): Synthesized engine output:
LONG: Confluent bullish setup (1H and 4H trends aligned upward, rising ATR, compliant external volatility).
SHORT: Confluent bearish setup (1H and 4H trends aligned downward, rising ATR, compliant external volatility).
WARN: FINE LONG / SHORT: Momentum exhaustion warning; price printing new extremes on declining volume/volatility.
EXHAUST DAILY: Daily range statistically spent; trading lock to prevent chasing overextensions.
FLAT: Inconclusive alignment or neutral state.
Built-in Alerts
Includes native alertcondition events for:
LONG and SHORT confluence entries.
WARNING momentum exhaustion alerts.
EXHAUST daily range threshold breaches.
General operational state changes.
🦅 Aquile Reali, nate per volare, nate per osare.
🦅 Royal Eagles, born to fly, born to dare.

AQUILE REALI – Educational tools by giua64
Disclaimer
The information and publications are not meant to be, and do not constitute, financial, investment, trading, or other types of advice or recommendations supplied or endorsed by TradingView. Read more in the Terms of Use.
AQUILE REALI – Educational tools by giua64
Disclaimer
The information and publications are not meant to be, and do not constitute, financial, investment, trading, or other types of advice or recommendations supplied or endorsed by TradingView. Read more in the Terms of Use.