COT Index 3 Timeframes
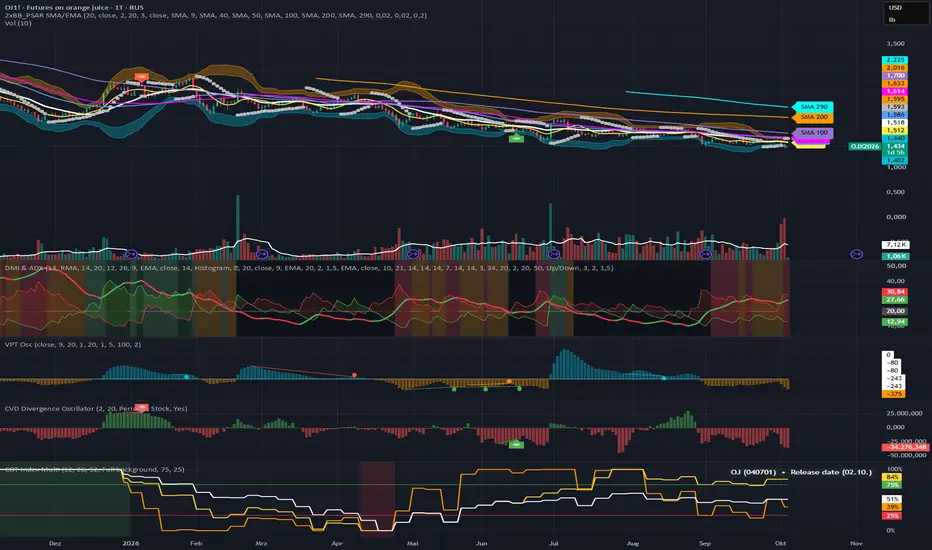
COT Index (Multiple Timeframes) – Follow the Smart Money on Any Chart
OVERVIEW
Every week, the CFTC reveals how the largest players in the futures markets are positioned. Commercials – producers, merchants and large hedgers – deal with the underlying asset every day, and their positioning often turns against the crowd at market extremes.
This indicator turns their net position into a clean 0–100 oscillator – across three lookback periods at once and on any chart timeframe you trade. No more switching to a weekly chart, no more inconsistent values between timeframes.
KEY ADVANTAGES
- Truly timeframe-independent: the lookback counts real weekly COT reports, not chart bars. A 26-week index is always 26 reports – on 1m, 1h, 1D, 1W or 1M.
- Three indices in one pane: short-, medium- and long-term positioning (default 12 / 26 / 52 weeks) side by side. When all three agree, the signal carries real weight.
- Honest history: COT data (as of Tuesday) is published Friday at 15:30 New York time. With "Hide the current week" enabled, each report appears only from its actual release – historical bars show exactly what traders could have known at that moment.
- Smart extreme detection: highlights moments when ALL visible indices reach the upper or lower threshold – as a subtle zone or full background.
- Futures Only or Futures + Options with a single click.
- Built-in symbol corrections for markets like Copper, Lumber, Lithium, Canola, Aluminum and Rough Rice.
- Info panel showing market, CFTC code, data type and release date of the report in use.
HOW TO READ IT
- 100 = Commercials at their most bullish net position of the period
- 0 = Commercials at their most bearish net position of the period
- Above the Upper Threshold (75) = bullish extreme, below the Lower Threshold (25) = bearish extreme
Extreme readings can point to potential turning points. Combine them with your own price-action or timing tools.
SETTINGS
- Number of weeks (Index 1 / 2 / 3): lookback periods in weekly reports (default 12 / 26 / 52).
- Show COT Index 1 / 2 / 3: show or hide each index. Hidden indices are excluded from the extreme marking.
- Include Options: switch between Futures Only and Futures + Options data. Not available for every market.
- Hide the current week (default on): uses a report only after its Friday release. Recommended for realistic analysis. Holiday delays are not considered.
- Mark long and short extremes: highlights bars where all visible indices are beyond the thresholds.
- Extreme marking style: "Zone beyond threshold" (subtle) or "Full background" (maximum visibility).
- Upper / Lower Threshold: levels for the lines, zones and extreme check (default 75 / 25).
NOTES
- Works on all futures markets covered by the CFTC COT report; the CFTC code is detected automatically.
- Uses the Legacy report (Commercial positions); values update once per week.
- "Could not find relevant COT data" means the symbol is not covered, or F+O data is unavailable – try disabling "Include Options".
OVERVIEW
Every week, the CFTC reveals how the largest players in the futures markets are positioned. Commercials – producers, merchants and large hedgers – deal with the underlying asset every day, and their positioning often turns against the crowd at market extremes.
This indicator turns their net position into a clean 0–100 oscillator – across three lookback periods at once and on any chart timeframe you trade. No more switching to a weekly chart, no more inconsistent values between timeframes.
KEY ADVANTAGES
- Truly timeframe-independent: the lookback counts real weekly COT reports, not chart bars. A 26-week index is always 26 reports – on 1m, 1h, 1D, 1W or 1M.
- Three indices in one pane: short-, medium- and long-term positioning (default 12 / 26 / 52 weeks) side by side. When all three agree, the signal carries real weight.
- Honest history: COT data (as of Tuesday) is published Friday at 15:30 New York time. With "Hide the current week" enabled, each report appears only from its actual release – historical bars show exactly what traders could have known at that moment.
- Smart extreme detection: highlights moments when ALL visible indices reach the upper or lower threshold – as a subtle zone or full background.
- Futures Only or Futures + Options with a single click.
- Built-in symbol corrections for markets like Copper, Lumber, Lithium, Canola, Aluminum and Rough Rice.
- Info panel showing market, CFTC code, data type and release date of the report in use.
HOW TO READ IT
- 100 = Commercials at their most bullish net position of the period
- 0 = Commercials at their most bearish net position of the period
- Above the Upper Threshold (75) = bullish extreme, below the Lower Threshold (25) = bearish extreme
Extreme readings can point to potential turning points. Combine them with your own price-action or timing tools.
SETTINGS
- Number of weeks (Index 1 / 2 / 3): lookback periods in weekly reports (default 12 / 26 / 52).
- Show COT Index 1 / 2 / 3: show or hide each index. Hidden indices are excluded from the extreme marking.
- Include Options: switch between Futures Only and Futures + Options data. Not available for every market.
- Hide the current week (default on): uses a report only after its Friday release. Recommended for realistic analysis. Holiday delays are not considered.
- Mark long and short extremes: highlights bars where all visible indices are beyond the thresholds.
- Extreme marking style: "Zone beyond threshold" (subtle) or "Full background" (maximum visibility).
- Upper / Lower Threshold: levels for the lines, zones and extreme check (default 75 / 25).
NOTES
- Works on all futures markets covered by the CFTC COT report; the CFTC code is detected automatically.
- Uses the Legacy report (Commercial positions); values update once per week.
- "Could not find relevant COT data" means the symbol is not covered, or F+O data is unavailable – try disabling "Include Options".

Disclaimer
The information and publications are not meant to be, and do not constitute, financial, investment, trading, or other types of advice or recommendations supplied or endorsed by TradingView. Read more in the Terms of Use.
Disclaimer
The information and publications are not meant to be, and do not constitute, financial, investment, trading, or other types of advice or recommendations supplied or endorsed by TradingView. Read more in the Terms of Use.