OPEN-SOURCE SCRIPT
[OPEN SOURCE] Whale Absorption & Liquidity Zones Indicator
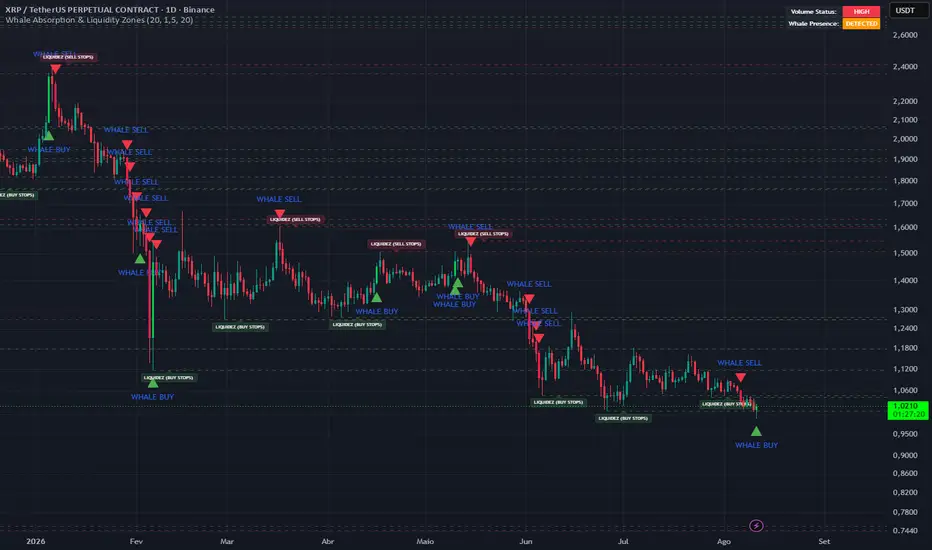
This indicator is designed to help traders identify institutional activity through Whale Absorption and Liquidity Zones. By analyzing volume anomalies and price action, it pinpoints where large players might be entering or defending positions.
Key Features:
Whale Absorption (Buy/Sell): Detects high-volume bars where price movement is restricted, suggesting that large orders are being absorbed.
Green Bar/Triangle: Institutional buying/absorption.
Red Bar/Triangle: Institutional selling/distribution.
Liquidity Zones: Automatically plots dashed lines at recent Pivot Highs and Lows (Buy/Sell Stops), showing where the "liquidity" (retail stop losses) is likely sitting.
Real-time Dashboard: A clean UI in the top-right corner monitors volume status and whale presence.
How to Trade:
Look for Whale Buy signals near Liquidity Buy Stops for potential high-probability reversals.
Use the dashboard to confirm if the current volume is "Normal" or "High" before entering a trade.
Key Features:
Whale Absorption (Buy/Sell): Detects high-volume bars where price movement is restricted, suggesting that large orders are being absorbed.
Green Bar/Triangle: Institutional buying/absorption.
Red Bar/Triangle: Institutional selling/distribution.
Liquidity Zones: Automatically plots dashed lines at recent Pivot Highs and Lows (Buy/Sell Stops), showing where the "liquidity" (retail stop losses) is likely sitting.
Real-time Dashboard: A clean UI in the top-right corner monitors volume status and whale presence.
How to Trade:
Look for Whale Buy signals near Liquidity Buy Stops for potential high-probability reversals.
Use the dashboard to confirm if the current volume is "Normal" or "High" before entering a trade.
Open-source script
In true TradingView spirit, the creator of this script has made it open-source, so that traders can review and verify its functionality. Kudos to the author! While you can use it for free, remember that republishing the code is subject to our House Rules.

Disclaimer
The information and publications are not meant to be, and do not constitute, financial, investment, trading, or other types of advice or recommendations supplied or endorsed by TradingView. Read more in the Terms of Use.
Open-source script
In true TradingView spirit, the creator of this script has made it open-source, so that traders can review and verify its functionality. Kudos to the author! While you can use it for free, remember that republishing the code is subject to our House Rules.
Disclaimer
The information and publications are not meant to be, and do not constitute, financial, investment, trading, or other types of advice or recommendations supplied or endorsed by TradingView. Read more in the Terms of Use.