Weekly Candle Right
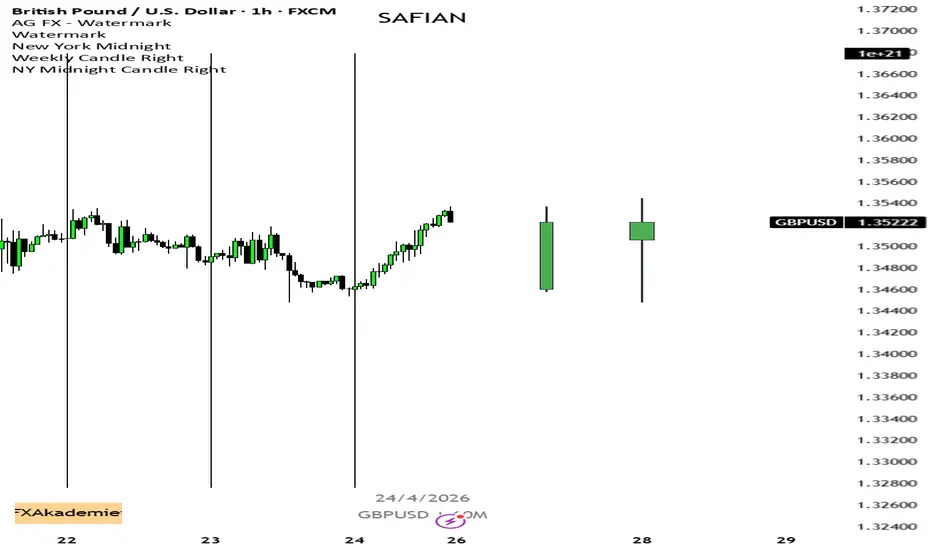
This indicator draws a custom weekly candle positioned to the right of the price action. It tracks the open, high, low, and close of the current week based on the New York timezone, rendering it as a color-coded box with wicks. Green indicates a bullish week (close ≥ open), red indicates bearish. Useful for keeping the higher timeframe context visible while trading on lower timeframes.

Disclaimer
The information and publications are not meant to be, and do not constitute, financial, investment, trading, or other types of advice or recommendations supplied or endorsed by TradingView. Read more in the Terms of Use.
Disclaimer
The information and publications are not meant to be, and do not constitute, financial, investment, trading, or other types of advice or recommendations supplied or endorsed by TradingView. Read more in the Terms of Use.