OPEN-SOURCE SCRIPT
Blau Jurik Ergodic Candlestick Oscillator (ECO)
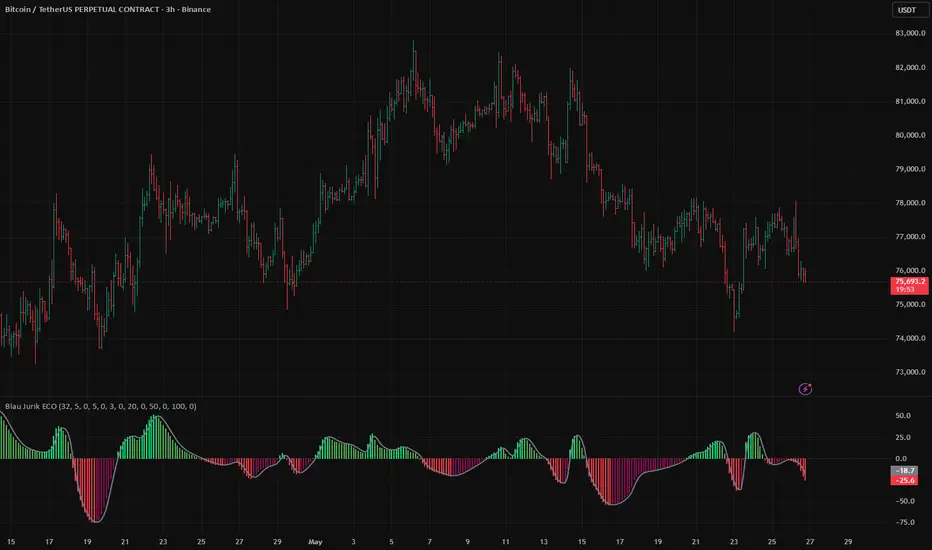
================================================================================
TECHNICAL DESCRIPTION: BLAU JURIK ERGODIC CANDLESTICK OSCILLATOR (ECO)
OVERVIEW
The Blau Jurik Ergodic Candlestick Oscillator (ECO) is a highly responsive
momentum-to-volatility ratio indicator. It is a modernized variation of William
Blau's classic Ergodic Candlestick Oscillator.
While the standard ECO uses simple or exponential moving averages for smoothing,
this implementation replaces those linear filters with a double-pass adaptive
Jurik Filter. This modification significantly reduces lag while minimizing overshoot,
resulting in a cleaner, faster signal that adapts to changing market volatility.
CORE CONSTRUCTS & MATHEMATICAL FORMULATING
The indicator processes two primary streams of candlestick data at each bar:
A. Candlestick Body Displacement (Net Directional Movement)
This measures the net price movement from open to close:
co = Close - Open
B. Candlestick High-Low Range (Total Local Volatility)
This measures the absolute range of price movement, serving as a baseline
for total market energy:
hl = High - Low
Rather than using these raw values directly—which would produce an unstable,
noisy oscillator—both "co" and "hl" are smoothed using two cascaded passes
of an adaptive Jurik Filter.
THE ADAPTIVE JURIK SMOOTHING PROCESS
The Jurik Filter adapts its smoothing speed dynamically based on localized market
volatility. When volatility spikes, the filter automatically reduces its
smoothing length (speeding up) to catch the trend. When volatility drops, it
increases its smoothing length (slowing down) to filter out noise.
The key steps in the adaptive algorithm are:
A. Volatility Calculation:
Calculate changes relative to the current and prior values:
del1 = InputValue - max(InputValue[1], InputValue)
del2 = InputValue - min(InputValue[1], InputValue)
volty = max(abs(del1), abs(del2))
B. Volatility Normalization:
The current volatility is compared to a long-term rolling average (such as
a 65-period Simple Moving Average) to determine whether the market is
experiencing higher or lower volatility than normal:
Relative Volatility = volty / AverageVolatility
C. Dynamic Speed Adjustment:
An adjustment factor (representing the filter's feedback speed) is scaled
by this Relative Volatility.
When Relative Volatility is high, the smoothing coefficient (alpha)
increases, making the filter highly responsive.
When Relative Volatility is low, alpha decreases, smoothing out market noise.
D. Phase-Correction and Double-Pass Smoothing:
The filter runs a multi-stage phase shift correction that offsets the
natural lag of moving averages.
To construct the Ergodic Oscillator, this process is run twice (cascaded):
SmoothedBody = JurikFilter(JurikFilter(co, Length1, Phase), Length2, Phase)
SmoothedRange = JurikFilter(JurikFilter(hl, Length1, Phase), Length2, Phase)
OSCILLATOR & SIGNAL CALCULATIONS
Once the body displacement and high-low range are smoothed, the ECO is calculated
as a percentage ratio of the two:
ECO = 100 * (SmoothedBody / SmoothedRange)
Because "co" can be positive or negative, the ECO oscillates between -100 and +100.
An ECO near +100 indicates that the bodies of the candlesticks are taking up
almost the entire high-low range in a positive direction (strong, clean uptrend).
An ECO near -100 indicates that the bodies are taking up almost the entire
range in a negative direction (strong, clean downtrend).
An ECO near 0 indicates range-bound, choppy, or rotating price action with
little directional progress.
Downstream Signal Lines:
To generate trade signals and identify trend changes, multiple downstream signal
lines are calculated by applying a Jurik Filter directly to the ECO output:
Signal1 = JurikFilter(ECO, SignalLength1, SignalPhase1)
Signal2 = JurikFilter(ECO, SignalLength2, SignalPhase2)
...and so on, up to five distinct signal lines.
INTERPRETATION & USE CASES
The ECO is typically used for three primary types of market analysis:
A. Zero-Line Crossovers:
When the ECO crosses above 0, it indicates that buying momentum is
overcoming the overall price range, establishing a bullish bias.
When the ECO crosses below 0, it indicates that selling momentum is
dominating, establishing a bearish bias.
B. Signal Line Crossovers:
Bullish Signal: The ECO line crosses above its primary Signal Line.
Bearish Signal: The ECO line crosses below its primary Signal Line.
C. Volatility & Compression Regimes:
When all downstream signal lines contract and cluster together, it signals
extreme price compression (a low-volatility environment). This state often
precedes an explosive expansion of volatility.
When the signal lines fan out widely, it indicates a highly directional,
mature trend.
================================================================================
TECHNICAL DESCRIPTION: BLAU JURIK ERGODIC CANDLESTICK OSCILLATOR (ECO)
OVERVIEW
The Blau Jurik Ergodic Candlestick Oscillator (ECO) is a highly responsive
momentum-to-volatility ratio indicator. It is a modernized variation of William
Blau's classic Ergodic Candlestick Oscillator.
While the standard ECO uses simple or exponential moving averages for smoothing,
this implementation replaces those linear filters with a double-pass adaptive
Jurik Filter. This modification significantly reduces lag while minimizing overshoot,
resulting in a cleaner, faster signal that adapts to changing market volatility.
CORE CONSTRUCTS & MATHEMATICAL FORMULATING
The indicator processes two primary streams of candlestick data at each bar:
A. Candlestick Body Displacement (Net Directional Movement)
This measures the net price movement from open to close:
co = Close - Open
B. Candlestick High-Low Range (Total Local Volatility)
This measures the absolute range of price movement, serving as a baseline
for total market energy:
hl = High - Low
Rather than using these raw values directly—which would produce an unstable,
noisy oscillator—both "co" and "hl" are smoothed using two cascaded passes
of an adaptive Jurik Filter.
THE ADAPTIVE JURIK SMOOTHING PROCESS
The Jurik Filter adapts its smoothing speed dynamically based on localized market
volatility. When volatility spikes, the filter automatically reduces its
smoothing length (speeding up) to catch the trend. When volatility drops, it
increases its smoothing length (slowing down) to filter out noise.
The key steps in the adaptive algorithm are:
A. Volatility Calculation:
Calculate changes relative to the current and prior values:
del1 = InputValue - max(InputValue[1], InputValue)
del2 = InputValue - min(InputValue[1], InputValue)
volty = max(abs(del1), abs(del2))
B. Volatility Normalization:
The current volatility is compared to a long-term rolling average (such as
a 65-period Simple Moving Average) to determine whether the market is
experiencing higher or lower volatility than normal:
Relative Volatility = volty / AverageVolatility
C. Dynamic Speed Adjustment:
An adjustment factor (representing the filter's feedback speed) is scaled
by this Relative Volatility.
When Relative Volatility is high, the smoothing coefficient (alpha)
increases, making the filter highly responsive.
When Relative Volatility is low, alpha decreases, smoothing out market noise.
D. Phase-Correction and Double-Pass Smoothing:
The filter runs a multi-stage phase shift correction that offsets the
natural lag of moving averages.
To construct the Ergodic Oscillator, this process is run twice (cascaded):
SmoothedBody = JurikFilter(JurikFilter(co, Length1, Phase), Length2, Phase)
SmoothedRange = JurikFilter(JurikFilter(hl, Length1, Phase), Length2, Phase)
OSCILLATOR & SIGNAL CALCULATIONS
Once the body displacement and high-low range are smoothed, the ECO is calculated
as a percentage ratio of the two:
ECO = 100 * (SmoothedBody / SmoothedRange)
Because "co" can be positive or negative, the ECO oscillates between -100 and +100.
An ECO near +100 indicates that the bodies of the candlesticks are taking up
almost the entire high-low range in a positive direction (strong, clean uptrend).
An ECO near -100 indicates that the bodies are taking up almost the entire
range in a negative direction (strong, clean downtrend).
An ECO near 0 indicates range-bound, choppy, or rotating price action with
little directional progress.
Downstream Signal Lines:
To generate trade signals and identify trend changes, multiple downstream signal
lines are calculated by applying a Jurik Filter directly to the ECO output:
Signal1 = JurikFilter(ECO, SignalLength1, SignalPhase1)
Signal2 = JurikFilter(ECO, SignalLength2, SignalPhase2)
...and so on, up to five distinct signal lines.
INTERPRETATION & USE CASES
The ECO is typically used for three primary types of market analysis:
A. Zero-Line Crossovers:
When the ECO crosses above 0, it indicates that buying momentum is
overcoming the overall price range, establishing a bullish bias.
When the ECO crosses below 0, it indicates that selling momentum is
dominating, establishing a bearish bias.
B. Signal Line Crossovers:
Bullish Signal: The ECO line crosses above its primary Signal Line.
Bearish Signal: The ECO line crosses below its primary Signal Line.
C. Volatility & Compression Regimes:
When all downstream signal lines contract and cluster together, it signals
extreme price compression (a low-volatility environment). This state often
precedes an explosive expansion of volatility.
When the signal lines fan out widely, it indicates a highly directional,
mature trend.
================================================================================
Open-source script
In true TradingView spirit, the creator of this script has made it open-source, so that traders can review and verify its functionality. Kudos to the author! While you can use it for free, remember that republishing the code is subject to our House Rules.

Disclaimer
The information and publications are not meant to be, and do not constitute, financial, investment, trading, or other types of advice or recommendations supplied or endorsed by TradingView. Read more in the Terms of Use.
Open-source script
In true TradingView spirit, the creator of this script has made it open-source, so that traders can review and verify its functionality. Kudos to the author! While you can use it for free, remember that republishing the code is subject to our House Rules.
Disclaimer
The information and publications are not meant to be, and do not constitute, financial, investment, trading, or other types of advice or recommendations supplied or endorsed by TradingView. Read more in the Terms of Use.