Updated
Eye Trend Zones [EyeAlgo]
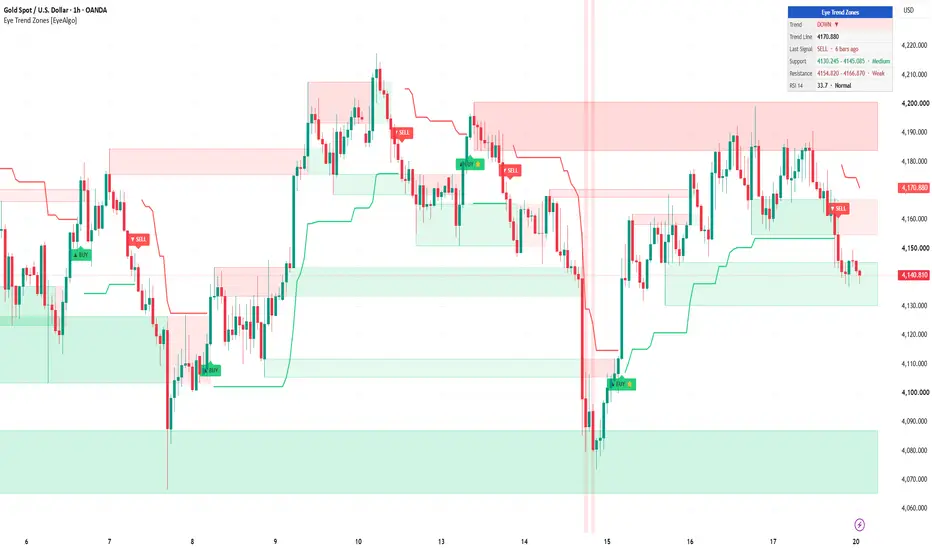
Eye Trend Zones puts three things on one clean chart: a trend line that gives the direction and the BUY / SELL timing, support & resistance zones built only from swings where price really reacted, and RSI extremes that show where price was stretched. Every signal is checked against the zones and recent RSI extremes and marked with ⭐ or ⭐⭐ when that context is present. A small dashboard sums it all up.

🟢 OVERVIEW
A trend tool tells you the direction, but not where price is likely to react. A support & resistance tool shows levels, but not the trend. Eye Trend Zones answers three questions on one screen:
• Which way is the trend?
• Where are the nearest important price areas above and below?
• Did this BUY / SELL happen at one of those areas, or after an RSI extreme?
🟢 WHAT MAKES IT ORIGINAL
The trend line uses TradingView's built-in Supertrend calculation (ta.supertrend). Everything built around it is original logic written for this script:
▶ Impulse-filtered zones: a swing high or low becomes a zone only if price moved away from it by at least a set number of ATRs. Small swings never create zones.
▶ Wick-to-body zone shape: each zone covers the rejection area of the swing candle (wick extreme to candle body), sized between 0.25 and 1.5 ATR, so a zone is never a thin line or a huge block.
▶ Zone memory: up to 12 zones per side are remembered, but only the ones nearest to price are drawn (2 per side by default). An older level further away is not lost — it reappears when price comes back to it.
▶ Strength shading: clean retests make a zone darker, retests that close deep inside it make it lighter. The dashboard grades the nearest zones Weak / Medium / Strong.
▶ One-time zone flip: broken resistance becomes support (and vice versa) once, drawn with a dotted outline.
▶ Candle-first scaling: zones are clipped to the price range of the candles on screen, so a far-away level never squeezes the chart.
▶ Confluence marks: each trend change is checked against the active zones and recent RSI extremes and labelled ⭐ / ⭐⭐.
▶ Theme-adaptive visuals: zone shading and the dashboard adapt automatically to light and dark charts.
🟢 HOW IT WORKS
1) Trend line and BUY / SELL
• GREEN line = uptrend, RED line = downtrend.
• ▲ BUY appears on the candle where the line turns green, ▼ SELL where it turns red.
• Signals are confirmed on bar close and do not repaint after the candle closes.
• Defaults: ATR Length 25, ATR Factor 2.5 — a responsive setting, so signals print close to swing lows and highs (see "Research behind the defaults").

2) Support & resistance zones
• A swing is confirmed after "Swing Length" bars on each side (default 8).
• A zone is drawn only if price moved at least "Min Move Away" × ATR from the swing (default 1.0 ATR).
• Resistance zone = body of the swing-high candle up to its wick high. Support zone = wick low of the swing-low candle up to its body.
• Overlapping zones on the same side merge (still limited to 1.5 ATR high).
• "Zones Per Side" (default 2) sets how many zones are drawn above and below price. When the memory is full, the zone farthest from price is dropped, never the nearest.
• A zone stays active until price closes through it.

3) Zone flip
When price closes through a zone, it flips once: broken resistance becomes support, broken support becomes resistance. Flipped zones have a dotted outline. A zone that flips on the same bar as a BUY / SELL does not count as confluence for that signal.
4) RSI extremes
Candles where RSI (default 14) is above 80 get a light green background stripe; candles below 20 get a light red stripe. The stripe runs the full height of the chart, so stretched moves are easy to spot at a glance.
• Green stripe (RSI above 80) = price was stretched UP. Watch for the trend to slow; a SELL that follows within 10 bars gets an RSI ⭐.
• Red stripe (RSI below 20) = price was stretched DOWN. A BUY that follows within 10 bars gets an RSI ⭐.
The levels (80 / 20), the RSI length and the stripe colours can be changed in the "RSI Candle Marks" settings.
Example (Gold 1H, chart below): on 14 Oct gold fell hard and RSI dropped below 20, so those candles show a light red stripe. Price was stretched to the downside there. A few bars later the trend line turned green and the BUY got a ⭐, because it came within 10 bars of that RSI extreme. A green stripe works the same way at the top: RSI above 80 marks a stretched rally, and a SELL soon after it gets a ⭐.
5) Confluence ⭐
• ⭐ = price touched a support zone (within 0.25 ATR) in the last 3 bars and did not close below it, OR RSI was below 20 within the last 10 bars. ⭐⭐ = both.
• With "Show Zones" off, ⭐ can only come from RSI.
• A SELL uses a resistance zone and RSI above 80.
• ⭐⭐ labels are drawn larger. Hover over any label to see which conditions were present.
Important: ⭐ means context, not a better signal. In our tests, signals with zone or RSI context did better on some charts and worse on others.
6) Dashboard
Trend, trend-line level, last signal (with stars and bars ago), nearest support and resistance with strength (Weak / Medium / Strong), and RSI state. When price is above every remembered resistance the dashboard says "None above (new high)".
🟢 RESEARCH BEHIND THE DEFAULTS
We tested the trend line on seven charts: OANDA XAUUSD 15m, 1H and 4H, XAGUSD 1H, EURUSD 1H, BITSTAMP BTCUSD 1H and NSE NIFTY 1H (all bars TradingView loads by default, about 5,000 – 11,000 bars each, October 2026). Each BUY was held until the next SELL and each SELL until the next BUY. Results are in ATR units, before spread and commission.
• 42 combinations (ATR Length 7 – 34 × ATR Factor 1.5 – 5.0) were tested on six of the charts (EURUSD was checked only with the final setting), each split into older 70 % and newer 30 % of bars. On every one of the six charts, the setting that looked best on the older data was not the best on the newer data, so we did not pick the top performer of one chart. ATR 14 / Factor 3.0 was the most consistent: profitable on the older data of all six charts, below a profit factor of 1.00 on the newer data of only 2 of 6, and the highest average newer-data profit factor.
• The default is ATR 25 / Factor 2.5 instead, because it reacts faster: BUY / SELL print closer to swing lows and highs, which many traders prefer on intraday charts. The cost is a few extra signals in sideways markets and weaker results on newer data in our tests (profit factor below 1.00 on 4 of 6 charts, versus 2 of 6 for ATR 14 / Factor 3.0). For fewer, steadier signals, set ATR Length 14 and ATR Factor 3.0.
• With ATR 14 / Factor 3.0, the profit factor (total winning moves ÷ total losing moves) was: Gold 15m 1.04, Gold 1H 1.17, Gold 4H 1.89, Silver 1H 1.14, EURUSD 1H 1.00, NIFTY 1H 1.20, BTCUSD 1H 1.35.
• With ATR 14 / Factor 3.0 only about 35 – 47 % of signals were winners. Trend-following of this kind makes its result from a smaller number of long moves, not from a high win rate.
• Filters we tested and did NOT add, because they did not help consistently across the charts: zone / RSI confluence, EMA-200 and higher-timeframe trend alignment, ADX, choppiness, break-even and fixed stops, and taking half profit at 1 ATR.
• Pullback entries (waiting for a pullback after the flip) raised the profit factor on most charts, but removed about 60 % of signals and failed on Gold 15m. They are not built in, to keep the signals simple.
• Weakest charts: EURUSD 1H and Gold 15m. Strongest: Gold 4H and BTCUSD 1H.
These are historical measurements on a limited sample, not a forecast.
🟢 HOW TO USE
1. Read the trend from the line colour.
2. Treat BUY / SELL as a change in trend, not as an automatic order. An opposite signal is the natural exit.
3. Use the nearest zones as areas where price may react: support below for BUY, resistance above for SELL.
4. Use ⭐ as extra context, not as a reason on its own.
5. Gold 15m was the weakest chart in our tests. Test on your own symbol and timeframe before using anything live.
🟢 HOW TO CHANGE SETTINGS
1. Add the indicator to your chart.
2. Double-click the trend line, or hover the indicator name at the top-left of the chart and click the ⚙ gear icon.
3. Change values in the "Inputs" tab and click OK. Colours are in the same tab; line styles are in the "Style" tab.
Quick guide:
• Fewer, steadier signals → ATR Length 14, ATR Factor 3.0. Earlier signals (more of them) → keep 25 / 2.5 or lower the factor.
• More or fewer zones → "Zones Per Side" (1 – 5).
• Only strong zones → raise "Min Move Away" (e.g. 1.5 – 2.0) or "Swing Length" (e.g. 12 – 15).
• Clean chart → switch off "Show RSI Candle Marks" or "Show Dashboard".
• Alerts → right-click the chart → Add alert → choose "Eye Trend Zones" and the condition (BUY, SELL, Confluence BUY ⭐ …).
🟢 SETTINGS
• Trend Line: ATR Length, ATR Factor, Show BUY / SELL, colours, Trend Fill.
• Support & Resistance Zones: Show Zones, Swing Length, Min Move Away (×ATR), Zones Per Side, Flip Broken Zones, Support and Resistance colours.
• RSI Candle Marks: on / off, RSI Length, Upper Level, Lower Level, colours.
• Confluence: on / off, RSI Look-back (bars).
• Alerts: detailed alert() messages on / off.
• Dashboard: on / off, position, text size.
🟢 ALERTS
• BUY / SELL
• Confluence BUY ⭐ / Confluence SELL ⭐
• RSI above upper level / RSI below lower level
• Detailed alert() message with direction, stars, price and trend line level ("Any alert() function call").
🟢 IMPORTANT NOTES & LIMITATIONS
• The research figures ignore spread, commission, slippage and position sizing. On low timeframes costs can remove a small edge completely.
• In sideways markets the trend line can flip often and give several signals close together.
• Zones need "Swing Length" bars to confirm, so a zone appears a few bars after the swing.
• Zones are drawn only within the price range of the candles on screen. Scroll or zoom out to see levels further away; the dashboard always shows the nearest ones.
• On the live candle the trend line, RSI stripe and dashboard can change until the candle closes. BUY / SELL labels and alerts appear only after the close.
• The script does not place trades.
🟢 DISCLAIMER
This indicator is for educational and analysis purposes only. It is not financial advice. Past behaviour on a chart does not guarantee future results. Always use your own analysis and risk management.
🟢 OVERVIEW
A trend tool tells you the direction, but not where price is likely to react. A support & resistance tool shows levels, but not the trend. Eye Trend Zones answers three questions on one screen:
• Which way is the trend?
• Where are the nearest important price areas above and below?
• Did this BUY / SELL happen at one of those areas, or after an RSI extreme?
🟢 WHAT MAKES IT ORIGINAL
The trend line uses TradingView's built-in Supertrend calculation (ta.supertrend). Everything built around it is original logic written for this script:
▶ Impulse-filtered zones: a swing high or low becomes a zone only if price moved away from it by at least a set number of ATRs. Small swings never create zones.
▶ Wick-to-body zone shape: each zone covers the rejection area of the swing candle (wick extreme to candle body), sized between 0.25 and 1.5 ATR, so a zone is never a thin line or a huge block.
▶ Zone memory: up to 12 zones per side are remembered, but only the ones nearest to price are drawn (2 per side by default). An older level further away is not lost — it reappears when price comes back to it.
▶ Strength shading: clean retests make a zone darker, retests that close deep inside it make it lighter. The dashboard grades the nearest zones Weak / Medium / Strong.
▶ One-time zone flip: broken resistance becomes support (and vice versa) once, drawn with a dotted outline.
▶ Candle-first scaling: zones are clipped to the price range of the candles on screen, so a far-away level never squeezes the chart.
▶ Confluence marks: each trend change is checked against the active zones and recent RSI extremes and labelled ⭐ / ⭐⭐.
▶ Theme-adaptive visuals: zone shading and the dashboard adapt automatically to light and dark charts.
🟢 HOW IT WORKS
1) Trend line and BUY / SELL
• GREEN line = uptrend, RED line = downtrend.
• ▲ BUY appears on the candle where the line turns green, ▼ SELL where it turns red.
• Signals are confirmed on bar close and do not repaint after the candle closes.
• Defaults: ATR Length 25, ATR Factor 2.5 — a responsive setting, so signals print close to swing lows and highs (see "Research behind the defaults").
2) Support & resistance zones
• A swing is confirmed after "Swing Length" bars on each side (default 8).
• A zone is drawn only if price moved at least "Min Move Away" × ATR from the swing (default 1.0 ATR).
• Resistance zone = body of the swing-high candle up to its wick high. Support zone = wick low of the swing-low candle up to its body.
• Overlapping zones on the same side merge (still limited to 1.5 ATR high).
• "Zones Per Side" (default 2) sets how many zones are drawn above and below price. When the memory is full, the zone farthest from price is dropped, never the nearest.
• A zone stays active until price closes through it.
3) Zone flip
When price closes through a zone, it flips once: broken resistance becomes support, broken support becomes resistance. Flipped zones have a dotted outline. A zone that flips on the same bar as a BUY / SELL does not count as confluence for that signal.
4) RSI extremes
Candles where RSI (default 14) is above 80 get a light green background stripe; candles below 20 get a light red stripe. The stripe runs the full height of the chart, so stretched moves are easy to spot at a glance.
• Green stripe (RSI above 80) = price was stretched UP. Watch for the trend to slow; a SELL that follows within 10 bars gets an RSI ⭐.
• Red stripe (RSI below 20) = price was stretched DOWN. A BUY that follows within 10 bars gets an RSI ⭐.
The levels (80 / 20), the RSI length and the stripe colours can be changed in the "RSI Candle Marks" settings.
Example (Gold 1H, chart below): on 14 Oct gold fell hard and RSI dropped below 20, so those candles show a light red stripe. Price was stretched to the downside there. A few bars later the trend line turned green and the BUY got a ⭐, because it came within 10 bars of that RSI extreme. A green stripe works the same way at the top: RSI above 80 marks a stretched rally, and a SELL soon after it gets a ⭐.
5) Confluence ⭐
• ⭐ = price touched a support zone (within 0.25 ATR) in the last 3 bars and did not close below it, OR RSI was below 20 within the last 10 bars. ⭐⭐ = both.
• With "Show Zones" off, ⭐ can only come from RSI.
• A SELL uses a resistance zone and RSI above 80.
• ⭐⭐ labels are drawn larger. Hover over any label to see which conditions were present.
Important: ⭐ means context, not a better signal. In our tests, signals with zone or RSI context did better on some charts and worse on others.
6) Dashboard
Trend, trend-line level, last signal (with stars and bars ago), nearest support and resistance with strength (Weak / Medium / Strong), and RSI state. When price is above every remembered resistance the dashboard says "None above (new high)".
🟢 RESEARCH BEHIND THE DEFAULTS
We tested the trend line on seven charts: OANDA XAUUSD 15m, 1H and 4H, XAGUSD 1H, EURUSD 1H, BITSTAMP BTCUSD 1H and NSE NIFTY 1H (all bars TradingView loads by default, about 5,000 – 11,000 bars each, October 2026). Each BUY was held until the next SELL and each SELL until the next BUY. Results are in ATR units, before spread and commission.
• 42 combinations (ATR Length 7 – 34 × ATR Factor 1.5 – 5.0) were tested on six of the charts (EURUSD was checked only with the final setting), each split into older 70 % and newer 30 % of bars. On every one of the six charts, the setting that looked best on the older data was not the best on the newer data, so we did not pick the top performer of one chart. ATR 14 / Factor 3.0 was the most consistent: profitable on the older data of all six charts, below a profit factor of 1.00 on the newer data of only 2 of 6, and the highest average newer-data profit factor.
• The default is ATR 25 / Factor 2.5 instead, because it reacts faster: BUY / SELL print closer to swing lows and highs, which many traders prefer on intraday charts. The cost is a few extra signals in sideways markets and weaker results on newer data in our tests (profit factor below 1.00 on 4 of 6 charts, versus 2 of 6 for ATR 14 / Factor 3.0). For fewer, steadier signals, set ATR Length 14 and ATR Factor 3.0.
• With ATR 14 / Factor 3.0, the profit factor (total winning moves ÷ total losing moves) was: Gold 15m 1.04, Gold 1H 1.17, Gold 4H 1.89, Silver 1H 1.14, EURUSD 1H 1.00, NIFTY 1H 1.20, BTCUSD 1H 1.35.
• With ATR 14 / Factor 3.0 only about 35 – 47 % of signals were winners. Trend-following of this kind makes its result from a smaller number of long moves, not from a high win rate.
• Filters we tested and did NOT add, because they did not help consistently across the charts: zone / RSI confluence, EMA-200 and higher-timeframe trend alignment, ADX, choppiness, break-even and fixed stops, and taking half profit at 1 ATR.
• Pullback entries (waiting for a pullback after the flip) raised the profit factor on most charts, but removed about 60 % of signals and failed on Gold 15m. They are not built in, to keep the signals simple.
• Weakest charts: EURUSD 1H and Gold 15m. Strongest: Gold 4H and BTCUSD 1H.
These are historical measurements on a limited sample, not a forecast.
🟢 HOW TO USE
1. Read the trend from the line colour.
2. Treat BUY / SELL as a change in trend, not as an automatic order. An opposite signal is the natural exit.
3. Use the nearest zones as areas where price may react: support below for BUY, resistance above for SELL.
4. Use ⭐ as extra context, not as a reason on its own.
5. Gold 15m was the weakest chart in our tests. Test on your own symbol and timeframe before using anything live.
🟢 HOW TO CHANGE SETTINGS
1. Add the indicator to your chart.
2. Double-click the trend line, or hover the indicator name at the top-left of the chart and click the ⚙ gear icon.
3. Change values in the "Inputs" tab and click OK. Colours are in the same tab; line styles are in the "Style" tab.
Quick guide:
• Fewer, steadier signals → ATR Length 14, ATR Factor 3.0. Earlier signals (more of them) → keep 25 / 2.5 or lower the factor.
• More or fewer zones → "Zones Per Side" (1 – 5).
• Only strong zones → raise "Min Move Away" (e.g. 1.5 – 2.0) or "Swing Length" (e.g. 12 – 15).
• Clean chart → switch off "Show RSI Candle Marks" or "Show Dashboard".
• Alerts → right-click the chart → Add alert → choose "Eye Trend Zones" and the condition (BUY, SELL, Confluence BUY ⭐ …).
🟢 SETTINGS
• Trend Line: ATR Length, ATR Factor, Show BUY / SELL, colours, Trend Fill.
• Support & Resistance Zones: Show Zones, Swing Length, Min Move Away (×ATR), Zones Per Side, Flip Broken Zones, Support and Resistance colours.
• RSI Candle Marks: on / off, RSI Length, Upper Level, Lower Level, colours.
• Confluence: on / off, RSI Look-back (bars).
• Alerts: detailed alert() messages on / off.
• Dashboard: on / off, position, text size.
🟢 ALERTS
• BUY / SELL
• Confluence BUY ⭐ / Confluence SELL ⭐
• RSI above upper level / RSI below lower level
• Detailed alert() message with direction, stars, price and trend line level ("Any alert() function call").
🟢 IMPORTANT NOTES & LIMITATIONS
• The research figures ignore spread, commission, slippage and position sizing. On low timeframes costs can remove a small edge completely.
• In sideways markets the trend line can flip often and give several signals close together.
• Zones need "Swing Length" bars to confirm, so a zone appears a few bars after the swing.
• Zones are drawn only within the price range of the candles on screen. Scroll or zoom out to see levels further away; the dashboard always shows the nearest ones.
• On the live candle the trend line, RSI stripe and dashboard can change until the candle closes. BUY / SELL labels and alerts appear only after the close.
• The script does not place trades.
🟢 DISCLAIMER
This indicator is for educational and analysis purposes only. It is not financial advice. Past behaviour on a chart does not guarantee future results. Always use your own analysis and risk management.
Release Notes
v1.1 — readability and alert fixes• BUY labels now use dark text on the green background, so they are easier to read on light and dark charts.
• Dashboard values (Trend, Last Signal, Support, Resistance, RSI) use a deeper shade on light chart themes for better readability.
• Zones removed because the zone memory was full are no longer left on the chart as history boxes. Only zones that were broken by a candle close stay as history.
• The "Confluence BUY ⭐" and "Confluence SELL ⭐" alert conditions now work even when "Mark Confluence ⭐" is switched off.
• New tooltips: ATR Length (it also sets zone size and the ⭐ zone distance) and alert setup (use the "Once Per Bar Close" frequency).
• Chart updated to show the script with default settings.
BUY / SELL, zone and ⭐ calculations are unchanged.

Disclaimer
The information and publications are not meant to be, and do not constitute, financial, investment, trading, or other types of advice or recommendations supplied or endorsed by TradingView. Read more in the Terms of Use.
Disclaimer
The information and publications are not meant to be, and do not constitute, financial, investment, trading, or other types of advice or recommendations supplied or endorsed by TradingView. Read more in the Terms of Use.