Kane's 20 & 200 SMA
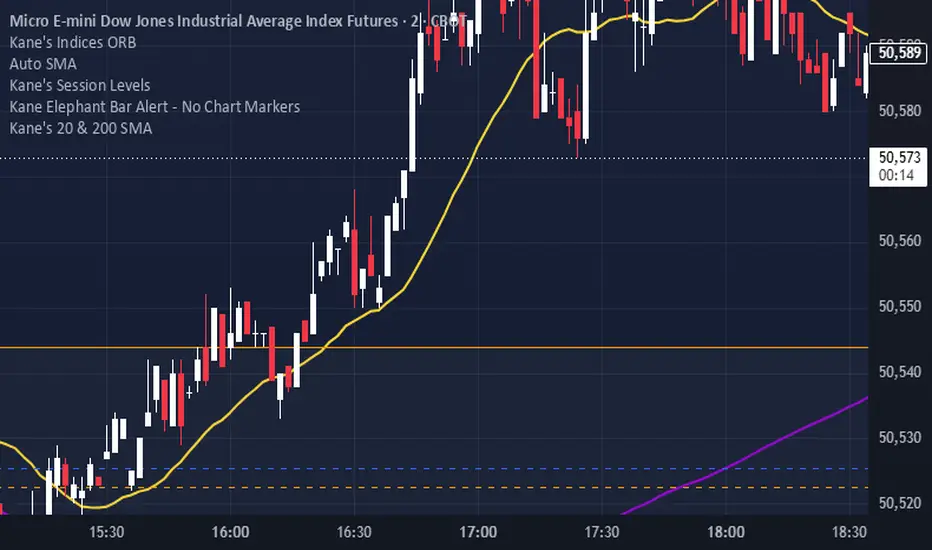
Kane's 20 & 200 SMA
A clean and lightweight dual moving average indicator designed for trend direction, market structure, and long-term bias analysis.
Features:
20 SMA in Yellow
200 SMA in Violet
Smooth overlay directly on price
Minimal chart clutter
Lightweight and responsive on all timeframes
Common Uses:
Identify overall market trend
Determine bullish vs bearish bias
Spot trend continuation setups
Find pullbacks into dynamic support/resistance
Track trend alignment between short and long-term structure
General Interpretation:
20 SMA above 200 SMA = bullish conditions
20 SMA below 200 SMA = bearish conditions
Strong separation can indicate momentum
Compression between averages can indicate consolidation or transition
Works on:
Stocks
Futures
Forex
Crypto
Indices
Gold & Silver
Fully customizable lengths, colors, and line thicknesses in settings.
A clean and lightweight dual moving average indicator designed for trend direction, market structure, and long-term bias analysis.
Features:
20 SMA in Yellow
200 SMA in Violet
Smooth overlay directly on price
Minimal chart clutter
Lightweight and responsive on all timeframes
Common Uses:
Identify overall market trend
Determine bullish vs bearish bias
Spot trend continuation setups
Find pullbacks into dynamic support/resistance
Track trend alignment between short and long-term structure
General Interpretation:
20 SMA above 200 SMA = bullish conditions
20 SMA below 200 SMA = bearish conditions
Strong separation can indicate momentum
Compression between averages can indicate consolidation or transition
Works on:
Stocks
Futures
Forex
Crypto
Indices
Gold & Silver
Fully customizable lengths, colors, and line thicknesses in settings.

Disclaimer
The information and publications are not meant to be, and do not constitute, financial, investment, trading, or other types of advice or recommendations supplied or endorsed by TradingView. Read more in the Terms of Use.
Disclaimer
The information and publications are not meant to be, and do not constitute, financial, investment, trading, or other types of advice or recommendations supplied or endorsed by TradingView. Read more in the Terms of Use.