OPEN-SOURCE SCRIPT
BTM Market Map
BTM Market Map
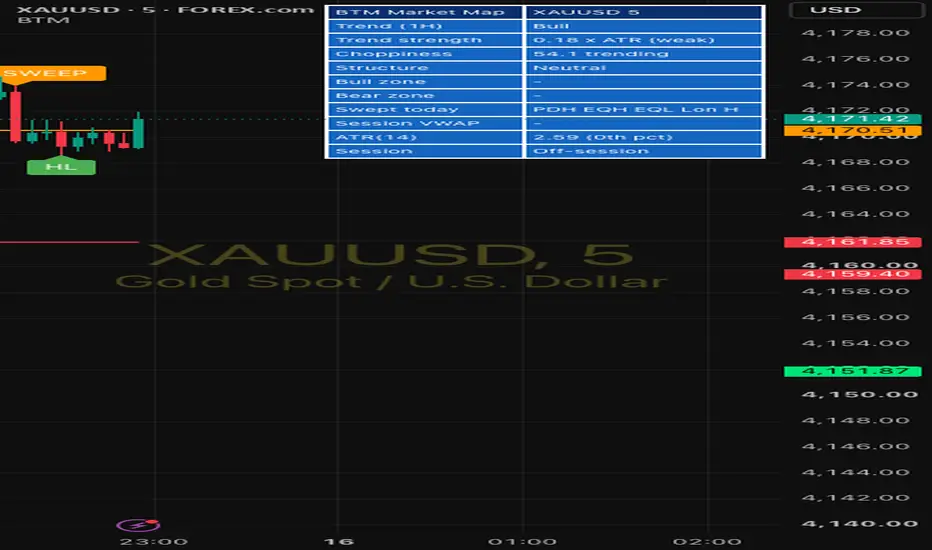
BTM Market Map is a market-context indicator for intraday XAUUSD (gold), designed for 5-minute and 15-minute charts during the London and New York sessions. It does not generate buy or sell signals. It maps market structure, liquidity and session context on the chart and summarises the current state in a dashboard, so the market can be read at a glance.
WHAT IT SHOWS
Market structure
• Swing highs and lows are found with pivots (5 bars left / 5 bars right by default) and labelled HH, HL, LH or LL.
• BULL / BEAR CHOCH marks the first close through the last opposing swing (change of character).
• BULL / BEAR BOS marks the close beyond the prior extreme that confirms the new direction (break of structure).
Pullback zones
• After a BOS, or after a new higher low / lower high in an established trend, a zone is drawn around that swing point, sized by ATR (0.5 x ATR(14) each side by default).
• Zones are named on the chart (BULL ZONE / BEAR ZONE, or DEMAND ZONE / SUPPLY ZONE) with the setup type (BOS or CONT), and expire after a set number of bars.
Liquidity levels and sweeps
• Previous day high/low, Asian session high/low (23:00-07:00 UK), previous week high/low, and equal highs/lows.
• A sweep is labelled when price wicks through a level and closes back inside it: previous day high/low, Asian high/low, equal highs/lows, and the London high/low during the New York window.
Session context
• London session and New York window shading.
• Session VWAP anchored at the London open, with ±1 standard deviation bands.
• US news windows in New York time (follows US daylight saving): first-Friday NFP proxy plus your own release and FOMC dates.
DASHBOARD
• Higher-timeframe trend (1H EMA 20/50 by default) and its strength (EMA gap measured in ATR).
• Choppiness Index: trending or choppy.
• Current structure: bullish, bearish or neutral.
• Active bull and bear zones, with price range and whether they have been touched.
• Levels swept today.
• Price above or below the session VWAP.
• ATR(14) and its percentile against recent London sessions.
• Current session and news-window status.
Position (9 options), text size, column width, colours and border thickness are all adjustable.
ALERTS
Price entered bull/bear zone, break of structure, change of character, previous-day high/low sweep, Asian high/low sweep, equal high/low sweep, London high/low sweep in the New York window, and news window starting. Set alerts to "Once Per Bar Close".
NOTES
• Higher-timeframe values (trend EMAs, ATR, Choppiness, previous day and week levels) use the last completed bar, so they do not repaint.
• Swing labels need the right-side pivot bars to confirm, so they appear 5 bars after the swing and are drawn back at the swing bar.
• On spot gold, VWAP is weighted by your broker's tick volume.
• News dates are entered manually; the first-Friday NFP rule is an approximation.
• Every layer can be switched on or off in the settings.
This indicator is a charting and analysis tool. It does not give trading advice or signals, and past structure does not predict future price.
BTM Market Map is a market-context indicator for intraday XAUUSD (gold), designed for 5-minute and 15-minute charts during the London and New York sessions. It does not generate buy or sell signals. It maps market structure, liquidity and session context on the chart and summarises the current state in a dashboard, so the market can be read at a glance.
WHAT IT SHOWS
Market structure
• Swing highs and lows are found with pivots (5 bars left / 5 bars right by default) and labelled HH, HL, LH or LL.
• BULL / BEAR CHOCH marks the first close through the last opposing swing (change of character).
• BULL / BEAR BOS marks the close beyond the prior extreme that confirms the new direction (break of structure).
Pullback zones
• After a BOS, or after a new higher low / lower high in an established trend, a zone is drawn around that swing point, sized by ATR (0.5 x ATR(14) each side by default).
• Zones are named on the chart (BULL ZONE / BEAR ZONE, or DEMAND ZONE / SUPPLY ZONE) with the setup type (BOS or CONT), and expire after a set number of bars.
Liquidity levels and sweeps
• Previous day high/low, Asian session high/low (23:00-07:00 UK), previous week high/low, and equal highs/lows.
• A sweep is labelled when price wicks through a level and closes back inside it: previous day high/low, Asian high/low, equal highs/lows, and the London high/low during the New York window.
Session context
• London session and New York window shading.
• Session VWAP anchored at the London open, with ±1 standard deviation bands.
• US news windows in New York time (follows US daylight saving): first-Friday NFP proxy plus your own release and FOMC dates.
DASHBOARD
• Higher-timeframe trend (1H EMA 20/50 by default) and its strength (EMA gap measured in ATR).
• Choppiness Index: trending or choppy.
• Current structure: bullish, bearish or neutral.
• Active bull and bear zones, with price range and whether they have been touched.
• Levels swept today.
• Price above or below the session VWAP.
• ATR(14) and its percentile against recent London sessions.
• Current session and news-window status.
Position (9 options), text size, column width, colours and border thickness are all adjustable.
ALERTS
Price entered bull/bear zone, break of structure, change of character, previous-day high/low sweep, Asian high/low sweep, equal high/low sweep, London high/low sweep in the New York window, and news window starting. Set alerts to "Once Per Bar Close".
NOTES
• Higher-timeframe values (trend EMAs, ATR, Choppiness, previous day and week levels) use the last completed bar, so they do not repaint.
• Swing labels need the right-side pivot bars to confirm, so they appear 5 bars after the swing and are drawn back at the swing bar.
• On spot gold, VWAP is weighted by your broker's tick volume.
• News dates are entered manually; the first-Friday NFP rule is an approximation.
• Every layer can be switched on or off in the settings.
This indicator is a charting and analysis tool. It does not give trading advice or signals, and past structure does not predict future price.
Open-source script
In true TradingView spirit, the creator of this script has made it open-source, so that traders can review and verify its functionality. Kudos to the author! While you can use it for free, remember that republishing the code is subject to our House Rules.

Disclaimer
The information and publications are not meant to be, and do not constitute, financial, investment, trading, or other types of advice or recommendations supplied or endorsed by TradingView. Read more in the Terms of Use.
Open-source script
In true TradingView spirit, the creator of this script has made it open-source, so that traders can review and verify its functionality. Kudos to the author! While you can use it for free, remember that republishing the code is subject to our House Rules.
Disclaimer
The information and publications are not meant to be, and do not constitute, financial, investment, trading, or other types of advice or recommendations supplied or endorsed by TradingView. Read more in the Terms of Use.