OPEN-SOURCE SCRIPT
RCA Relative Volume (RVol)
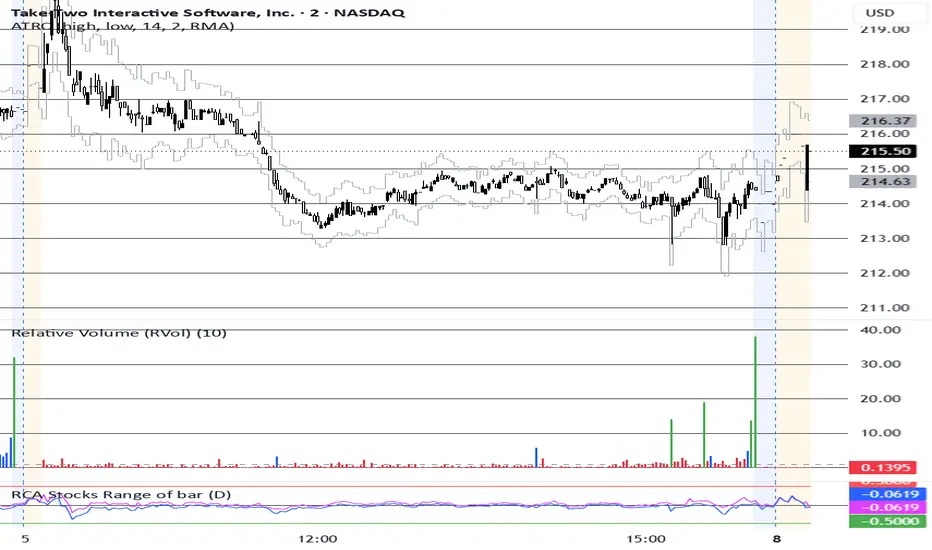
In the financial and trading markets, RVOL stands for Relative Volume. It is a technical indicator that compares the current trading volume of a stock (or other asset) to its average historical volume over a specified period (such as 10, 20, or 30 days). In this case, the average is calculated over the data of the same time of day (ex. 9:45 am current volume vs 10-day 9:45 am average volume).
The Formula= Current Volume/Volume.
RVOL of 1.0: The asset is trading at its exact average volume for that time of day.
RVOL above 2.0: The asset is "in play" and trading at twice its normal volume. This usually signals heightened market interest, increased liquidity, and the potential for large, volatile price movements.
RVOL below 1.0: The asset is experiencing lower-than-average market participation, typically resulting in a quieter, less volatile trading session.
The Formula= Current Volume/Volume.
RVOL of 1.0: The asset is trading at its exact average volume for that time of day.
RVOL above 2.0: The asset is "in play" and trading at twice its normal volume. This usually signals heightened market interest, increased liquidity, and the potential for large, volatile price movements.
RVOL below 1.0: The asset is experiencing lower-than-average market participation, typically resulting in a quieter, less volatile trading session.
Open-source script
In true TradingView spirit, the creator of this script has made it open-source, so that traders can review and verify its functionality. Kudos to the author! While you can use it for free, remember that republishing the code is subject to our House Rules.

Disclaimer
The information and publications are not meant to be, and do not constitute, financial, investment, trading, or other types of advice or recommendations supplied or endorsed by TradingView. Read more in the Terms of Use.
Open-source script
In true TradingView spirit, the creator of this script has made it open-source, so that traders can review and verify its functionality. Kudos to the author! While you can use it for free, remember that republishing the code is subject to our House Rules.
Disclaimer
The information and publications are not meant to be, and do not constitute, financial, investment, trading, or other types of advice or recommendations supplied or endorsed by TradingView. Read more in the Terms of Use.