Donchian Channels + Donchian Trend
Donchian Channels + Donchian Trend
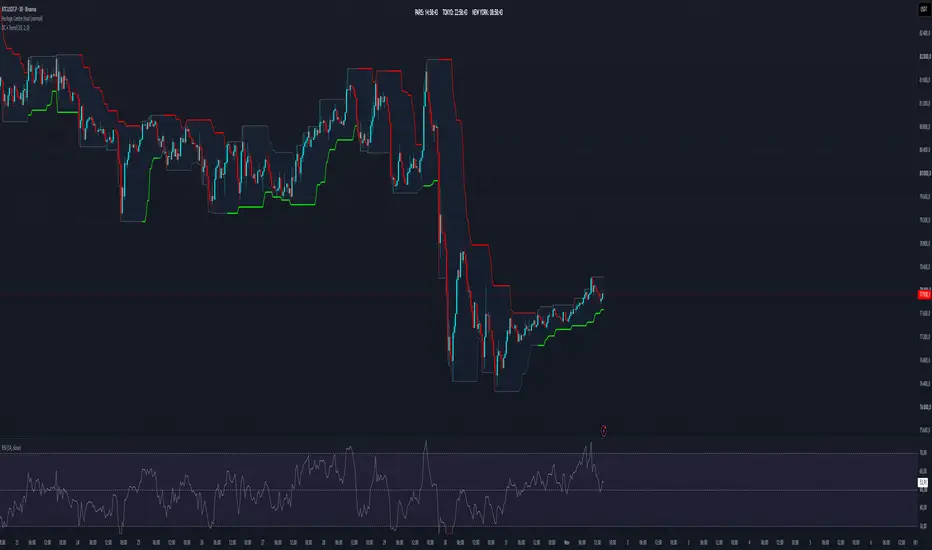
This indicator combines classic Donchian Channels with the Donchian Trend logic originally developed by LonesomeTheBlue. It brings channel boundaries, breakout direction, and trend alignment together in a single overlay.
HOW IT WORKS
The Donchian Channel displays the highest high and lowest low over the selected lookback period, along with an optional midpoint and background fill.
The trend switches bullish when price closes strictly above the previous bar’s upper channel boundary. It switches bearish when price closes strictly below the previous bar’s lower boundary. Otherwise, the previous trend state is maintained.
• Bullish trend: the lower channel boundary is highlighted in green by default.
• Bearish trend: the upper channel boundary is highlighted in red by default.
• Optional color intensity reflects agreement between the main trend and nine shorter Donchian lookback periods. This measures alignment across lookback periods, not across timeframes.
Optional arrows reproduce the original script’s conditions, highlighting selected channel touches and partial trend alignment. They are not standalone buy or sell signals.
CUSTOMIZATION
• Shared Donchian lookback period, with a default of 20 bars.
• Adjustable trend line width.
• Separate colors for channel boundaries, midpoint, background, trend lines, and arrows.
• Optional trend color intensity.
• Individual visibility controls for the channel, midpoint, fill, trend line, and arrows.
• Visual channel offset, which does not shift the trend calculations.
READING THE INDICATOR
The current channel includes the active candle, so its boundaries can move as new highs or lows form. Breakout direction is calculated against the previous bar’s channel boundaries.
On an open candle, the trend state can change before the candle closes. Wait for the bar to close when assessing a confirmed breakout.
The channel and trend component use related price data. Their agreement should not be treated as two independent confirmations. Sideways markets can produce frequent direction changes and false breakouts.
CREDITS
Donchian Trend logic: © LonesomeTheBlue.
Combined and adapted to Pine Script v6.
Licensed under the Mozilla Public License 2.0.
The RSI and session clocks visible in the example chart are separate indicators and are not included in this script.
This indicator combines classic Donchian Channels with the Donchian Trend logic originally developed by LonesomeTheBlue. It brings channel boundaries, breakout direction, and trend alignment together in a single overlay.
HOW IT WORKS
The Donchian Channel displays the highest high and lowest low over the selected lookback period, along with an optional midpoint and background fill.
The trend switches bullish when price closes strictly above the previous bar’s upper channel boundary. It switches bearish when price closes strictly below the previous bar’s lower boundary. Otherwise, the previous trend state is maintained.
• Bullish trend: the lower channel boundary is highlighted in green by default.
• Bearish trend: the upper channel boundary is highlighted in red by default.
• Optional color intensity reflects agreement between the main trend and nine shorter Donchian lookback periods. This measures alignment across lookback periods, not across timeframes.
Optional arrows reproduce the original script’s conditions, highlighting selected channel touches and partial trend alignment. They are not standalone buy or sell signals.
CUSTOMIZATION
• Shared Donchian lookback period, with a default of 20 bars.
• Adjustable trend line width.
• Separate colors for channel boundaries, midpoint, background, trend lines, and arrows.
• Optional trend color intensity.
• Individual visibility controls for the channel, midpoint, fill, trend line, and arrows.
• Visual channel offset, which does not shift the trend calculations.
READING THE INDICATOR
The current channel includes the active candle, so its boundaries can move as new highs or lows form. Breakout direction is calculated against the previous bar’s channel boundaries.
On an open candle, the trend state can change before the candle closes. Wait for the bar to close when assessing a confirmed breakout.
The channel and trend component use related price data. Their agreement should not be treated as two independent confirmations. Sideways markets can produce frequent direction changes and false breakouts.
CREDITS
Donchian Trend logic: © LonesomeTheBlue.
Combined and adapted to Pine Script v6.
Licensed under the Mozilla Public License 2.0.
The RSI and session clocks visible in the example chart are separate indicators and are not included in this script.

Disclaimer
The information and publications are not meant to be, and do not constitute, financial, investment, trading, or other types of advice or recommendations supplied or endorsed by TradingView. Read more in the Terms of Use.
Disclaimer
The information and publications are not meant to be, and do not constitute, financial, investment, trading, or other types of advice or recommendations supplied or endorsed by TradingView. Read more in the Terms of Use.