OPEN-SOURCE SCRIPT
IANI Liquidity M/W Scalper
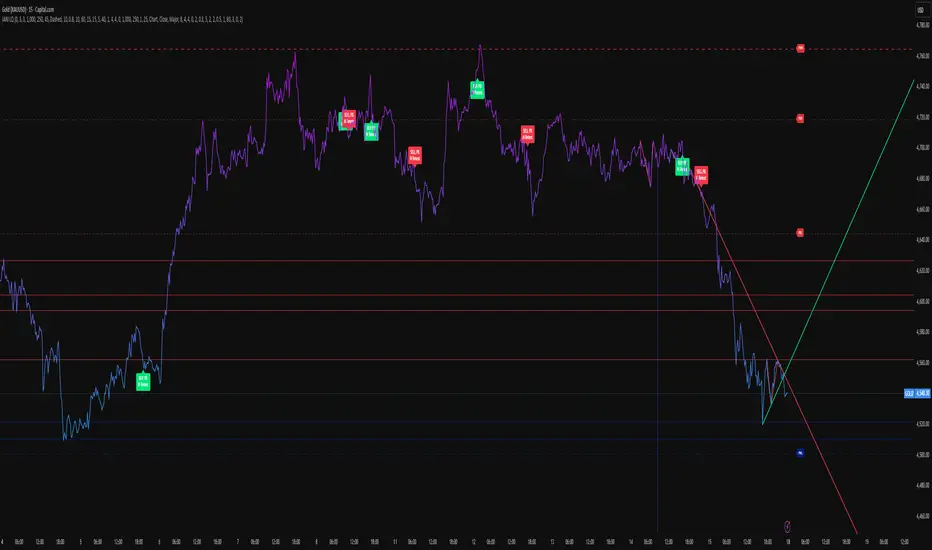
English description
IANI Liquidity M/W Scalper is a price-action scalping indicator designed mainly for low-timeframe execution, especially M1 and M5.
The indicator combines:
liquidity levels: PDH / PDL / PWH / PWL
higher-timeframe support and resistance
local trendline breakout structure
M / W reversal patterns
breakout + pullback / retest logic
optional EMA 50 / EMA 200, hidden by default
The goal is to help identify:
where liquidity is located
where important reaction zones are
where price may reverse or continue
where local breakout structure appears
where a pullback entry may form
How to use — English
1. Start with the main map
First, watch the main liquidity levels:
PDH = Previous Day High
PDL = Previous Day Low
PWH = Previous Week High
PWL = Previous Week Low
These are liquidity areas. Price may move toward them to take liquidity, trigger stops, or react.
2. Use higher-timeframe support and resistance
Support and resistance are calculated from higher timeframes, such as H1.
Basic idea:
near support, look for BUY setups
near resistance, look for SELL setups
after a breakout, watch the next level as a possible target
Do not enter only because price touches a line. Wait for reaction, structure, rejection, or retest.
3. Use the trendline for scalp structure
The trendline is for local scalp structure.
By default, it uses Chart TF:
on M1, it draws trendlines from M1 pivots
on M5, it draws trendlines from M5 pivots
Usage:
green line below price = local bullish structure
break below it = possible SELL watch
red line above price = local bearish structure
break above it = possible BUY watch
4. Use M / W patterns for confirmation
M/W patterns help with reversal setups:
W near support / PDL / liquidity zone = possible BUY
M near resistance / PDH / liquidity zone = possible SELL
The most useful labels are:
BUY PB / W Retest
SELL PB / M Retest
This means the pattern had a breakout and then a pullback/retest.
5. Safer entry workflow
Do not enter every label blindly.
Better process:
1. Price reaches an important area: PDH / PDL / S/R / weekly level
2. Price reacts
3. M or W structure forms
4. Local structure or trendline breaks
5. Wait for pullback / retest
6. Enter with a small SL behind structure
Recommended settings for M1 scalping
Show EMA 50 / EMA 200 = OFF
Show Liquidity Zones = ON
Show Previous Day High / Low = ON
Show Previous Week High / Low = ON
Show Daily Swings = OFF
Show Weekly Swings = OFF
S/R Source TF = 60
Visible S/R Above = 3 or 4
Visible S/R Below = 3 or 4
Trendline Source TF = Chart
Trendline Swing Mode = Major
Show TL Break Labels = OFF
Show M/W Retest Entry Labels = ON
Important
This is not a blind buy/sell system.
Use it with market structure, liquidity, session timing, risk management, and confirmation from price action.
IANI Liquidity M/W Scalper is a price-action scalping indicator designed mainly for low-timeframe execution, especially M1 and M5.
The indicator combines:
liquidity levels: PDH / PDL / PWH / PWL
higher-timeframe support and resistance
local trendline breakout structure
M / W reversal patterns
breakout + pullback / retest logic
optional EMA 50 / EMA 200, hidden by default
The goal is to help identify:
where liquidity is located
where important reaction zones are
where price may reverse or continue
where local breakout structure appears
where a pullback entry may form
How to use — English
1. Start with the main map
First, watch the main liquidity levels:
PDH = Previous Day High
PDL = Previous Day Low
PWH = Previous Week High
PWL = Previous Week Low
These are liquidity areas. Price may move toward them to take liquidity, trigger stops, or react.
2. Use higher-timeframe support and resistance
Support and resistance are calculated from higher timeframes, such as H1.
Basic idea:
near support, look for BUY setups
near resistance, look for SELL setups
after a breakout, watch the next level as a possible target
Do not enter only because price touches a line. Wait for reaction, structure, rejection, or retest.
3. Use the trendline for scalp structure
The trendline is for local scalp structure.
By default, it uses Chart TF:
on M1, it draws trendlines from M1 pivots
on M5, it draws trendlines from M5 pivots
Usage:
green line below price = local bullish structure
break below it = possible SELL watch
red line above price = local bearish structure
break above it = possible BUY watch
4. Use M / W patterns for confirmation
M/W patterns help with reversal setups:
W near support / PDL / liquidity zone = possible BUY
M near resistance / PDH / liquidity zone = possible SELL
The most useful labels are:
BUY PB / W Retest
SELL PB / M Retest
This means the pattern had a breakout and then a pullback/retest.
5. Safer entry workflow
Do not enter every label blindly.
Better process:
1. Price reaches an important area: PDH / PDL / S/R / weekly level
2. Price reacts
3. M or W structure forms
4. Local structure or trendline breaks
5. Wait for pullback / retest
6. Enter with a small SL behind structure
Recommended settings for M1 scalping
Show EMA 50 / EMA 200 = OFF
Show Liquidity Zones = ON
Show Previous Day High / Low = ON
Show Previous Week High / Low = ON
Show Daily Swings = OFF
Show Weekly Swings = OFF
S/R Source TF = 60
Visible S/R Above = 3 or 4
Visible S/R Below = 3 or 4
Trendline Source TF = Chart
Trendline Swing Mode = Major
Show TL Break Labels = OFF
Show M/W Retest Entry Labels = ON
Important
This is not a blind buy/sell system.
Use it with market structure, liquidity, session timing, risk management, and confirmation from price action.
Open-source script
In true TradingView spirit, the creator of this script has made it open-source, so that traders can review and verify its functionality. Kudos to the author! While you can use it for free, remember that republishing the code is subject to our House Rules.

SLTP
Disclaimer
The information and publications are not meant to be, and do not constitute, financial, investment, trading, or other types of advice or recommendations supplied or endorsed by TradingView. Read more in the Terms of Use.
Open-source script
In true TradingView spirit, the creator of this script has made it open-source, so that traders can review and verify its functionality. Kudos to the author! While you can use it for free, remember that republishing the code is subject to our House Rules.
SLTP
Disclaimer
The information and publications are not meant to be, and do not constitute, financial, investment, trading, or other types of advice or recommendations supplied or endorsed by TradingView. Read more in the Terms of Use.