OPEN-SOURCE SCRIPT
SMI Multi-Timeframe Oscillator
OVERVIEW
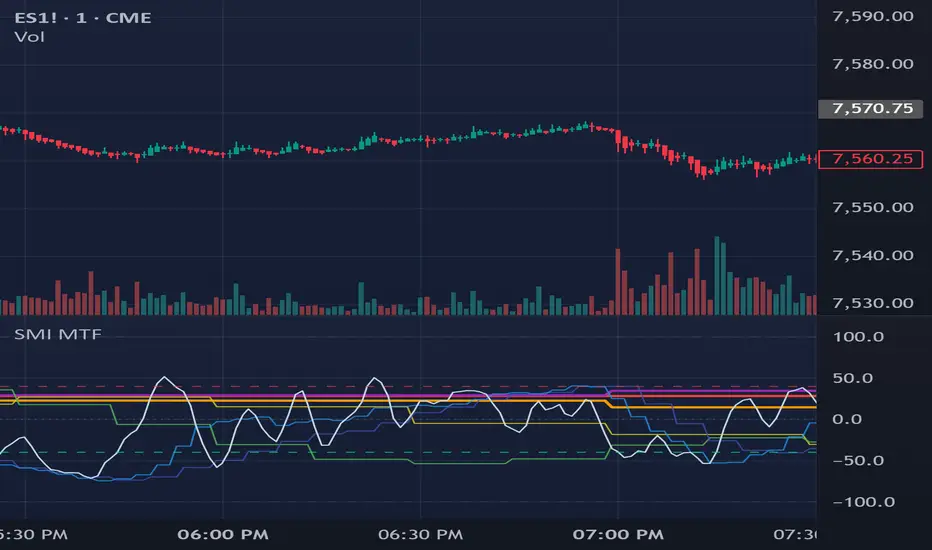
The SMI Multi-Timeframe Oscillator combines up to eight independently configurable Stochastic Momentum Index timeframes in one clean oscillator pane. It is designed to make momentum alignment, disagreement, and turning points across fast and slow timeframes easier to compare at a glance.
CONFIGURABLE TIMEFRAMES
• Eight individual timeframe slots
• A separate on/off toggle for every slot
• A timeframe dropdown for every slot
• Defaults: 1m, 3m, 5m, 15m, 30m, 1H, 2H, and 4H
Users can replace any default with their own preferred timeframe without editing the source code.
HOW IT WORKS
The indicator uses the standard double-EMA Stochastic Momentum Index calculation. SMI measures where price sits relative to the midpoint of its recent high-low range, then smooths both momentum and range before producing a naturally normalized oscillator.
• +100 represents the upper end of the scale
• 0 is the momentum midpoint
• -100 represents the lower end of the scale
• Default overbought and oversold references are +40 and -40
The %K length, %D smoothing, signal EMA length, source, and threshold levels are adjustable.
VISUAL DESIGN
Each timeframe slot receives a distinct color. Faster timeframes use thinner, more subdued lines, while slower timeframes are slightly stronger to create a readable visual hierarchy.
The current chart-timeframe SMI is shown as a thin soft-silver line. Optional signal lines are available but disabled by default. The indicator intentionally uses no channel fills or background shading.
INTERPRETATION
When several timeframes rise or fall together, momentum is broadly aligned. Divergence between fast and slow lines can reveal developing transitions or timeframe disagreement.
Readings above zero indicate positive momentum relative to the recent range midpoint. Readings below zero indicate negative momentum. Moves near or beyond the overbought and oversold references should be interpreted in context; strong trends can keep SMI elevated or depressed for extended periods.
NOTES
Higher-timeframe values can change until their corresponding candles close. Lower-timeframe information displayed on a higher-timeframe chart is sampled according to TradingView's multi-timeframe behavior.
This indicator is intended for informational and educational purposes only. It is not financial advice and does not guarantee future results.
The SMI Multi-Timeframe Oscillator combines up to eight independently configurable Stochastic Momentum Index timeframes in one clean oscillator pane. It is designed to make momentum alignment, disagreement, and turning points across fast and slow timeframes easier to compare at a glance.
CONFIGURABLE TIMEFRAMES
• Eight individual timeframe slots
• A separate on/off toggle for every slot
• A timeframe dropdown for every slot
• Defaults: 1m, 3m, 5m, 15m, 30m, 1H, 2H, and 4H
Users can replace any default with their own preferred timeframe without editing the source code.
HOW IT WORKS
The indicator uses the standard double-EMA Stochastic Momentum Index calculation. SMI measures where price sits relative to the midpoint of its recent high-low range, then smooths both momentum and range before producing a naturally normalized oscillator.
• +100 represents the upper end of the scale
• 0 is the momentum midpoint
• -100 represents the lower end of the scale
• Default overbought and oversold references are +40 and -40
The %K length, %D smoothing, signal EMA length, source, and threshold levels are adjustable.
VISUAL DESIGN
Each timeframe slot receives a distinct color. Faster timeframes use thinner, more subdued lines, while slower timeframes are slightly stronger to create a readable visual hierarchy.
The current chart-timeframe SMI is shown as a thin soft-silver line. Optional signal lines are available but disabled by default. The indicator intentionally uses no channel fills or background shading.
INTERPRETATION
When several timeframes rise or fall together, momentum is broadly aligned. Divergence between fast and slow lines can reveal developing transitions or timeframe disagreement.
Readings above zero indicate positive momentum relative to the recent range midpoint. Readings below zero indicate negative momentum. Moves near or beyond the overbought and oversold references should be interpreted in context; strong trends can keep SMI elevated or depressed for extended periods.
NOTES
Higher-timeframe values can change until their corresponding candles close. Lower-timeframe information displayed on a higher-timeframe chart is sampled according to TradingView's multi-timeframe behavior.
This indicator is intended for informational and educational purposes only. It is not financial advice and does not guarantee future results.
Open-source script
In true TradingView spirit, the creator of this script has made it open-source, so that traders can review and verify its functionality. Kudos to the author! While you can use it for free, remember that republishing the code is subject to our House Rules.

Disclaimer
The information and publications are not meant to be, and do not constitute, financial, investment, trading, or other types of advice or recommendations supplied or endorsed by TradingView. Read more in the Terms of Use.
Open-source script
In true TradingView spirit, the creator of this script has made it open-source, so that traders can review and verify its functionality. Kudos to the author! While you can use it for free, remember that republishing the code is subject to our House Rules.
Disclaimer
The information and publications are not meant to be, and do not constitute, financial, investment, trading, or other types of advice or recommendations supplied or endorsed by TradingView. Read more in the Terms of Use.