Buy the Dip Score [Frank's Scanner]
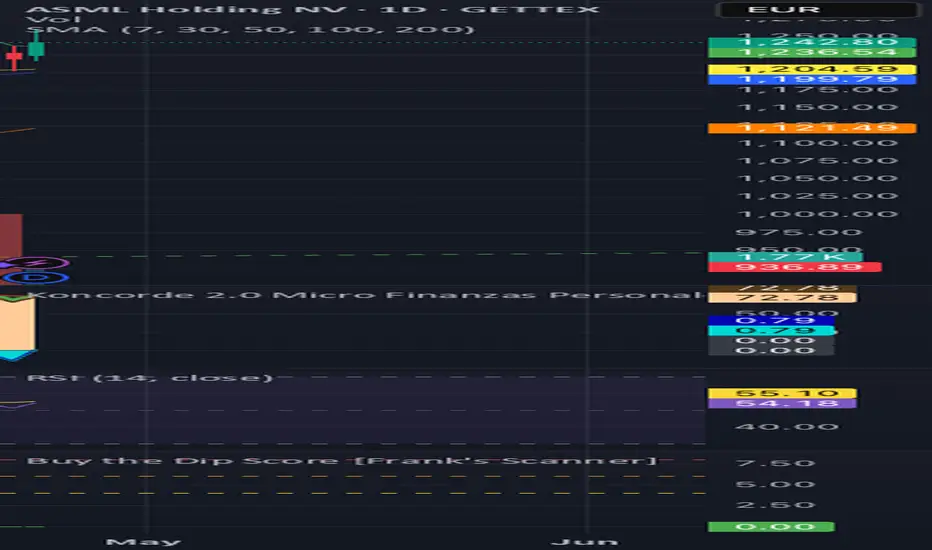
Look at the bottom panel — the indicator now shows:
NEW Color Logic (Option A: Buy the Dip)
┌───────────┬───────┬─────────────────────┬──────────────────────┐
│ Color │ Score │ Meaning │ Action │
├───────────┼───────┼─────────────────────┼──────────────────────┤
│ 🔴 RED │ 8-10 │ EXTREME OVERSOLD │ 🚀 BEST TIME TO BUY! │
├───────────┼───────┼─────────────────────┼──────────────────────┤
│ 🟠 ORANGE │ 6-8 │ VERY OVERSOLD │ 💪 Strong buy signal │
├───────────┼───────┼─────────────────────┼──────────────────────┤
│ 🟡 YELLOW │ 4-6 │ MODERATELY OVERSOLD │ ✅ Buy opportunity │
├───────────┼───────┼─────────────────────┼──────────────────────┤
│ 🟢 LIME │ 2-4 │ Slightly weak │ ⚠️ Caution │
├───────────┼───────┼─────────────────────┼──────────────────────┤
│ 🟢 GREEN │ 0-2 │ OVERBOUGHT │ ❌ Avoid/Sell │
└───────────┴───────┴─────────────────────┴──────────────────────┘
---
📊 What It's Measuring (Oversold Conditions)
HIGH SCORE (RED) When:
- ✅ RSI < 30 (extreme oversold)
- ✅ MACD below signal line (momentum down)
- ✅ Price below SMA 50 AND 200 (strong downtrend)
- ✅ Price near lower Bollinger Band (stretched down)
This is PANIC SELLING = Your buying opportunity!
NEW Color Logic (Option A: Buy the Dip)
┌───────────┬───────┬─────────────────────┬──────────────────────┐
│ Color │ Score │ Meaning │ Action │
├───────────┼───────┼─────────────────────┼──────────────────────┤
│ 🔴 RED │ 8-10 │ EXTREME OVERSOLD │ 🚀 BEST TIME TO BUY! │
├───────────┼───────┼─────────────────────┼──────────────────────┤
│ 🟠 ORANGE │ 6-8 │ VERY OVERSOLD │ 💪 Strong buy signal │
├───────────┼───────┼─────────────────────┼──────────────────────┤
│ 🟡 YELLOW │ 4-6 │ MODERATELY OVERSOLD │ ✅ Buy opportunity │
├───────────┼───────┼─────────────────────┼──────────────────────┤
│ 🟢 LIME │ 2-4 │ Slightly weak │ ⚠️ Caution │
├───────────┼───────┼─────────────────────┼──────────────────────┤
│ 🟢 GREEN │ 0-2 │ OVERBOUGHT │ ❌ Avoid/Sell │
└───────────┴───────┴─────────────────────┴──────────────────────┘
---
📊 What It's Measuring (Oversold Conditions)
HIGH SCORE (RED) When:
- ✅ RSI < 30 (extreme oversold)
- ✅ MACD below signal line (momentum down)
- ✅ Price below SMA 50 AND 200 (strong downtrend)
- ✅ Price near lower Bollinger Band (stretched down)
This is PANIC SELLING = Your buying opportunity!

Disclaimer
The information and publications are not meant to be, and do not constitute, financial, investment, trading, or other types of advice or recommendations supplied or endorsed by TradingView. Read more in the Terms of Use.
Disclaimer
The information and publications are not meant to be, and do not constitute, financial, investment, trading, or other types of advice or recommendations supplied or endorsed by TradingView. Read more in the Terms of Use.