ATK/DEF Power Swing -HP Minor Swing Point
# ATK/DEF Power Swing -HP Minor Swing Point
## Overview
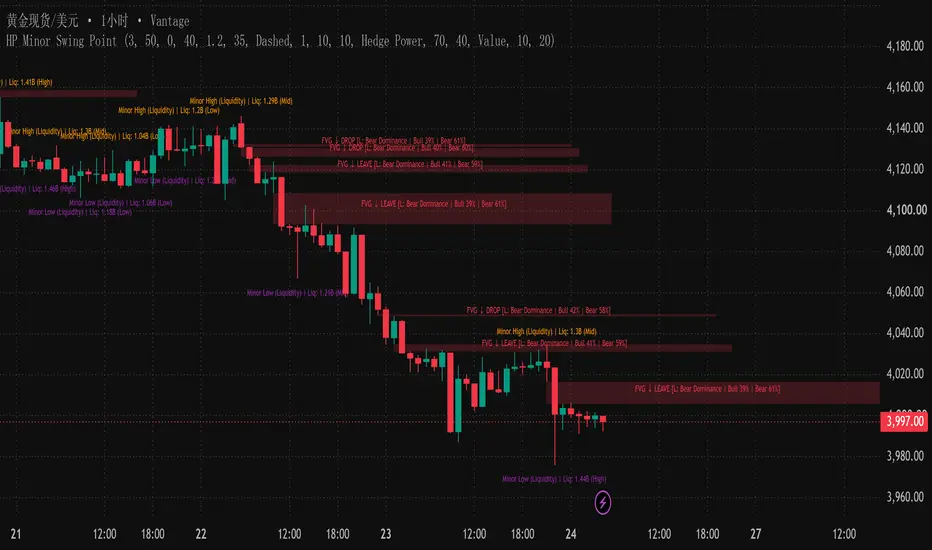
**ATK/DEF Power Swing -HP Minor Swing Point** is a market structure analysis indicator focused on Minor Swing Points, HP-based movement classification, liquidity activity measurement, BOS/CHoCH structure events, and Fair Value Gap (FVG) lifecycle tracking.
The indicator combines several analytical components into one chart-based framework, allowing users to observe minor structural changes, compare relative activity, and follow the development of price gaps over time.
## Key Features
### 1. Minor Swing Structure
- Identifies Minor Swing Highs and Minor Swing Lows using pivot-based calculations.
- Displays swing-point labels to make local structural changes easier to observe.
- Provides the reference points used by the structure-break module.
### 2. HP Analysis
- Supports **Hedge Power**, **Hidden Power**, and **Hybrid Power** modes.
- Calculates a rule-based HP score from directional volume and candle-body information across a defined swing interval.
- Optionally displays scores and strength grades using configurable thresholds.
- Classifies selected movement patterns, including Real Accumulation, Fake Distribution, Hidden Accumulation/Distribution, and Hybrid Bull/Bear.
These classifications represent the indicator's calculation rules and should not be interpreted as verified institutional activity or statistical probabilities.
### 3. Minor Liquidity Activity
- Measures activity around minor swing points.
- Supports three calculation modes: **Volume**, **Value**, and **Volatility**.
- Compares measured activity against a historical sample to assign relative High, Mid, or Low grades when sufficient samples are available.
These measurements are analytical proxies derived from chart data; they do not represent a direct measurement of total market liquidity.
### 4. BOS / CHoCH Structure Events
- Detects structure breaks using candle-close confirmation against stored swing levels.
- Distinguishes BOS and CHoCH events according to the script's internal structure state.
- Supports optional horizontal break lines and directional event labels.
### 5. FVG Lifecycle Analysis
- Detects bullish and bearish Fair Value Gaps using a three-candle price-gap condition.
- Tracks the development of each gap through a four-stage process:
- **Bullish:** CLIMB → INSIDE → LEAVE / STOP
- **Bearish:** DROP → INSIDE → LEAVE / STOP
- Tracks candle-direction-based volume composition within FVG zones.
- Displays relative volume percentages and dominance classifications according to the configured threshold.
- Manages gap objects as price interacts with their boundaries.
The volume composition is derived from candle direction and available chart volume. It is not direct exchange-level transaction-flow data.
## Chart Examples
**Example 1**

**Example 2**

**Example 3**

**Example 4**

## Intended Use
This indicator is designed for **market structure observation and analytical visualization**. It brings minor swing structure, HP classifications, relative activity measurements, BOS/CHoCH events, and FVG lifecycle information together in a unified chart layout.
## Overview
**ATK/DEF Power Swing -HP Minor Swing Point** is a market structure analysis indicator focused on Minor Swing Points, HP-based movement classification, liquidity activity measurement, BOS/CHoCH structure events, and Fair Value Gap (FVG) lifecycle tracking.
The indicator combines several analytical components into one chart-based framework, allowing users to observe minor structural changes, compare relative activity, and follow the development of price gaps over time.
## Key Features
### 1. Minor Swing Structure
- Identifies Minor Swing Highs and Minor Swing Lows using pivot-based calculations.
- Displays swing-point labels to make local structural changes easier to observe.
- Provides the reference points used by the structure-break module.
### 2. HP Analysis
- Supports **Hedge Power**, **Hidden Power**, and **Hybrid Power** modes.
- Calculates a rule-based HP score from directional volume and candle-body information across a defined swing interval.
- Optionally displays scores and strength grades using configurable thresholds.
- Classifies selected movement patterns, including Real Accumulation, Fake Distribution, Hidden Accumulation/Distribution, and Hybrid Bull/Bear.
These classifications represent the indicator's calculation rules and should not be interpreted as verified institutional activity or statistical probabilities.
### 3. Minor Liquidity Activity
- Measures activity around minor swing points.
- Supports three calculation modes: **Volume**, **Value**, and **Volatility**.
- Compares measured activity against a historical sample to assign relative High, Mid, or Low grades when sufficient samples are available.
These measurements are analytical proxies derived from chart data; they do not represent a direct measurement of total market liquidity.
### 4. BOS / CHoCH Structure Events
- Detects structure breaks using candle-close confirmation against stored swing levels.
- Distinguishes BOS and CHoCH events according to the script's internal structure state.
- Supports optional horizontal break lines and directional event labels.
### 5. FVG Lifecycle Analysis
- Detects bullish and bearish Fair Value Gaps using a three-candle price-gap condition.
- Tracks the development of each gap through a four-stage process:
- **Bullish:** CLIMB → INSIDE → LEAVE / STOP
- **Bearish:** DROP → INSIDE → LEAVE / STOP
- Tracks candle-direction-based volume composition within FVG zones.
- Displays relative volume percentages and dominance classifications according to the configured threshold.
- Manages gap objects as price interacts with their boundaries.
The volume composition is derived from candle direction and available chart volume. It is not direct exchange-level transaction-flow data.
## Chart Examples
**Example 1**
**Example 2**
**Example 3**
**Example 4**
## Intended Use
This indicator is designed for **market structure observation and analytical visualization**. It brings minor swing structure, HP classifications, relative activity measurements, BOS/CHoCH events, and FVG lifecycle information together in a unified chart layout.

Disclaimer
The information and publications are not meant to be, and do not constitute, financial, investment, trading, or other types of advice or recommendations supplied or endorsed by TradingView. Read more in the Terms of Use.
Disclaimer
The information and publications are not meant to be, and do not constitute, financial, investment, trading, or other types of advice or recommendations supplied or endorsed by TradingView. Read more in the Terms of Use.