OPEN-SOURCE SCRIPT
MA Envelope 15%
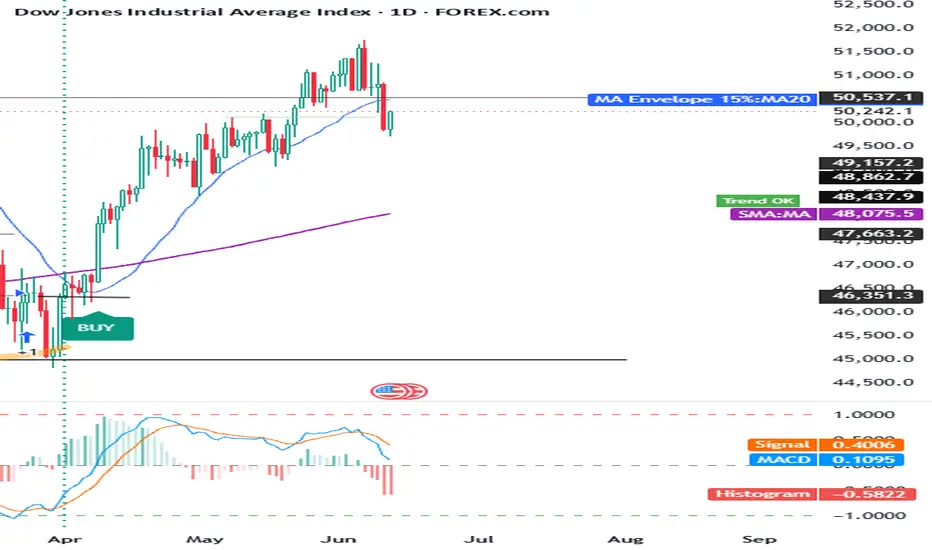
Traders use this type of indicator to identify extreme price deviations, potential mean reversion opportunities, and trend strength. When price moves near or beyond the upper band, it may suggest overextension or overbought conditions. When price approaches the lower band, it may indicate oversold conditions or potential value zones.
Overall, this indicator is a simple but effective way to visualize volatility boundaries around a trend and to support decision-making in trend-following or mean-reversion strategies.
You can adjust the % yourself according to your instrument.
Overall, this indicator is a simple but effective way to visualize volatility boundaries around a trend and to support decision-making in trend-following or mean-reversion strategies.
You can adjust the % yourself according to your instrument.
Open-source script
In true TradingView spirit, the creator of this script has made it open-source, so that traders can review and verify its functionality. Kudos to the author! While you can use it for free, remember that republishing the code is subject to our House Rules.

Disclaimer
The information and publications are not meant to be, and do not constitute, financial, investment, trading, or other types of advice or recommendations supplied or endorsed by TradingView. Read more in the Terms of Use.
Open-source script
In true TradingView spirit, the creator of this script has made it open-source, so that traders can review and verify its functionality. Kudos to the author! While you can use it for free, remember that republishing the code is subject to our House Rules.
Disclaimer
The information and publications are not meant to be, and do not constitute, financial, investment, trading, or other types of advice or recommendations supplied or endorsed by TradingView. Read more in the Terms of Use.