HOV Discount Zones
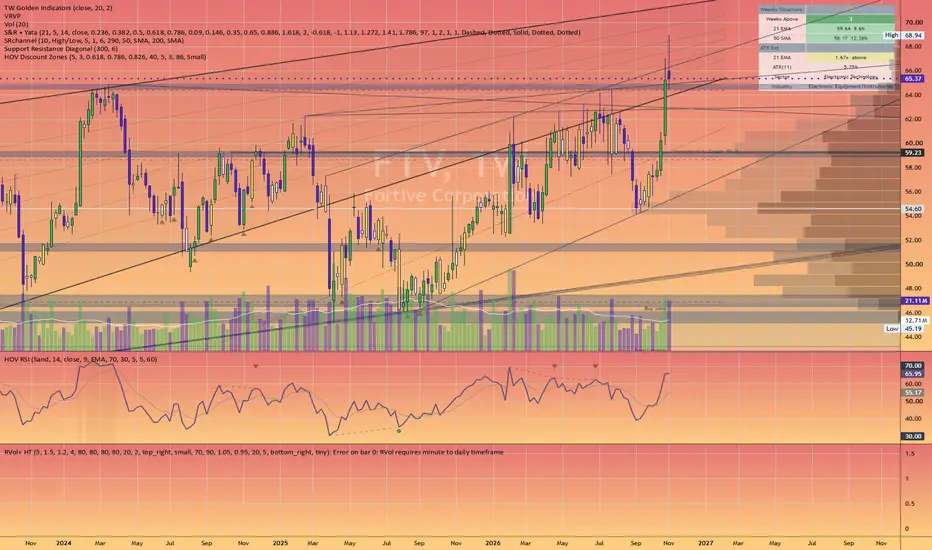
HOV DISCOUNT ZONES
Find where big money is likely to buy the pullback, then wait for the market to prove it.
HOV Discount Zones turns market structure into clean buy and sell areas. Instead of drawing a Fibonacci by hand on every chart, it finds the real swings for you, draws the discount zone where pullbacks tend to be bought, and tells you when price breaks back up out of that zone.
────────────────────────
1. HOW IT FINDS REAL SWINGS
────────────────────────
Most charts are full of small wiggles. This indicator only uses swings that matter:
• A swing high is confirmed once 5 candles close after it without making a higher high.
• When price CLOSES above that confirmed high, that is a break of structure: the trend is still up.
• The swing low of that move is the lowest low between the old high and the break.
• The next confirmed high completes the move. That move (swing low to swing high) is what the zone is drawn on.
Highs made before the old high is broken are treated as internal noise and ignored. This keeps the zones anchored to real moves, not random pivots.
────────────────────────
2. HOW THE ZONES ARE DRAWN
────────────────────────
A Fibonacci is measured from the swing high (0) down to the swing low (1):
• INSTITUTIONAL BUY ZONE: 0.618 to 0.786
The first area where larger buyers usually step back in. Strong stocks often bounce from here.
• SMART MONEY ZONE: 0.786 to 0.826
The deeper part of the pullback. Better price, but if price falls much further the move is in trouble.
• SWING LOW (1.0)
The line in the sand. A close below it means the move that created the zone has failed, and the zone is removed.
• SWING HIGH (0)
The natural target if the zone holds and the trend resumes.
SELL ZONES are the mirror image on bearish moves: a premium area where rallies tend to be sold.
────────────────────────
3. HIGHER-TIMEFRAME ZONES
────────────────────────
Weekly zones carry the most weight, so they are shown on lower charts too (8H, 4H, 1H...). You can also show Daily zones on intraday charts. This lets you trade a lower timeframe while respecting the bigger picture.
────────────────────────
4. NO CLUTTER: CLOSEST ZONE ONLY
────────────────────────
By default only the zone that matters right now is drawn:
• the buy zone price is sitting in (or the nearest one below), and
• the nearest sell zone above.
Older zones are still tracked in the background for the signals and alerts. They reappear on the chart when price moves toward them. Turn "Only the zone closest to price" off to see every zone.
────────────────────────
5. THE SIGNALS
────────────────────────
TRIGGER (green label)
This is the main signal. All of these must be true:
• price touched a weekly buy zone within the last 40 bars,
• the zone HELD: price never traded below the 0.826 smart money line,
• the chart then closes above its last swing high for the first time (structure turns back up),
• the close is above the daily 50-day average,
• the swing high target is still at least 5% away.
In plain words: the stock pulled back into a discount, buyers defended it, and the trend restarted. It only fires once per visit to a zone.
BUY (gold triangle)
An earlier, more aggressive signal: price touched a buy zone and B-Xtrender momentum turned up within a few bars. It comes before the TRIGGER, with less confirmation.
STOP AND TARGET LINES
After a BUY, the indicator draws the plan: the stop under the swing low and the target at the swing high, so you can judge the reward against the risk before entering.
────────────────────────
6. THE CORNER TABLE (WEEKLY STRUCTURE)
────────────────────────
• Weeks Below / Above: how many weekly closes in a row are below (red) or above (green) the weekly 21 EMA. Long streaks below mean the trend is still weak.
• 21 EMA and 50 SMA: the weekly averages and how far price is from each, in %.
• ATR Ext: how many weekly ATRs price is stretched from the 21 EMA. Far stretched = extended, closer = more room.
• ATR(11): the weekly range as a % of price, a quick read on how volatile the stock is (and how wide a stop needs to be).
• Sector and Industry: so you know what group the stock trades with.
────────────────────────
7. ALERTS
────────────────────────
• Entered a buy zone
• Entered a sell zone
• BUY: zone + momentum turn
• TRIGGER: zone held + structure break
Set them once and let the chart call you.
────────────────────────
8. HOW TO USE IT
────────────────────────
1. Start on the weekly or daily chart. Note the active buy zone, its swing low and its swing high.
2. When price pulls into the zone, do not chase. Zones are areas to watch, not buy signals by themselves; price often trades through the top of a zone before it holds.
3. Watch the 0.826 line. If price closes well below it, the zone is weakening.
4. Wait for the TRIGGER: the break back above the last swing high.
5. Plan the trade: stop under the swing low (or a tighter rule you prefer), target at the swing high.
6. Size the position by the distance to the stop. On weekly zones that distance can be large, so risk a small, fixed amount per trade.
Tips
• Weekly zones built on large swings are the most reliable. Daily zones on small swings get broken far more often.
• A breakout on above-average volume is more convincing than one on light volume.
• Check earnings dates: a gap can jump straight through a stop.
────────────────────────
9. SETTINGS
────────────────────────
• Candles to confirm a swing (default 5)
• Active zones kept per side (default 3)
• Fib levels: zone top 0.618, institutional / smart money line 0.786, smart money bottom 0.826
• Show weekly zones on lower timeframes · show daily zones on intraday charts
• Show sell zones · only the zone closest to price · label the swing high and low
• TRIGGER: bars allowed after the touch, swing size for the break
• Colors, fill transparency and label size
────────────────────────
DISCLAIMER
This indicator is for education and research. It reads past price data and does arithmetic; it does not predict the future and is not financial advice. Zones fail, signals can be wrong, and you can lose money. Make your own decisions and manage your risk.
Find where big money is likely to buy the pullback, then wait for the market to prove it.
HOV Discount Zones turns market structure into clean buy and sell areas. Instead of drawing a Fibonacci by hand on every chart, it finds the real swings for you, draws the discount zone where pullbacks tend to be bought, and tells you when price breaks back up out of that zone.
────────────────────────
1. HOW IT FINDS REAL SWINGS
────────────────────────
Most charts are full of small wiggles. This indicator only uses swings that matter:
• A swing high is confirmed once 5 candles close after it without making a higher high.
• When price CLOSES above that confirmed high, that is a break of structure: the trend is still up.
• The swing low of that move is the lowest low between the old high and the break.
• The next confirmed high completes the move. That move (swing low to swing high) is what the zone is drawn on.
Highs made before the old high is broken are treated as internal noise and ignored. This keeps the zones anchored to real moves, not random pivots.
────────────────────────
2. HOW THE ZONES ARE DRAWN
────────────────────────
A Fibonacci is measured from the swing high (0) down to the swing low (1):
• INSTITUTIONAL BUY ZONE: 0.618 to 0.786
The first area where larger buyers usually step back in. Strong stocks often bounce from here.
• SMART MONEY ZONE: 0.786 to 0.826
The deeper part of the pullback. Better price, but if price falls much further the move is in trouble.
• SWING LOW (1.0)
The line in the sand. A close below it means the move that created the zone has failed, and the zone is removed.
• SWING HIGH (0)
The natural target if the zone holds and the trend resumes.
SELL ZONES are the mirror image on bearish moves: a premium area where rallies tend to be sold.
────────────────────────
3. HIGHER-TIMEFRAME ZONES
────────────────────────
Weekly zones carry the most weight, so they are shown on lower charts too (8H, 4H, 1H...). You can also show Daily zones on intraday charts. This lets you trade a lower timeframe while respecting the bigger picture.
────────────────────────
4. NO CLUTTER: CLOSEST ZONE ONLY
────────────────────────
By default only the zone that matters right now is drawn:
• the buy zone price is sitting in (or the nearest one below), and
• the nearest sell zone above.
Older zones are still tracked in the background for the signals and alerts. They reappear on the chart when price moves toward them. Turn "Only the zone closest to price" off to see every zone.
────────────────────────
5. THE SIGNALS
────────────────────────
TRIGGER (green label)
This is the main signal. All of these must be true:
• price touched a weekly buy zone within the last 40 bars,
• the zone HELD: price never traded below the 0.826 smart money line,
• the chart then closes above its last swing high for the first time (structure turns back up),
• the close is above the daily 50-day average,
• the swing high target is still at least 5% away.
In plain words: the stock pulled back into a discount, buyers defended it, and the trend restarted. It only fires once per visit to a zone.
BUY (gold triangle)
An earlier, more aggressive signal: price touched a buy zone and B-Xtrender momentum turned up within a few bars. It comes before the TRIGGER, with less confirmation.
STOP AND TARGET LINES
After a BUY, the indicator draws the plan: the stop under the swing low and the target at the swing high, so you can judge the reward against the risk before entering.
────────────────────────
6. THE CORNER TABLE (WEEKLY STRUCTURE)
────────────────────────
• Weeks Below / Above: how many weekly closes in a row are below (red) or above (green) the weekly 21 EMA. Long streaks below mean the trend is still weak.
• 21 EMA and 50 SMA: the weekly averages and how far price is from each, in %.
• ATR Ext: how many weekly ATRs price is stretched from the 21 EMA. Far stretched = extended, closer = more room.
• ATR(11): the weekly range as a % of price, a quick read on how volatile the stock is (and how wide a stop needs to be).
• Sector and Industry: so you know what group the stock trades with.
────────────────────────
7. ALERTS
────────────────────────
• Entered a buy zone
• Entered a sell zone
• BUY: zone + momentum turn
• TRIGGER: zone held + structure break
Set them once and let the chart call you.
────────────────────────
8. HOW TO USE IT
────────────────────────
1. Start on the weekly or daily chart. Note the active buy zone, its swing low and its swing high.
2. When price pulls into the zone, do not chase. Zones are areas to watch, not buy signals by themselves; price often trades through the top of a zone before it holds.
3. Watch the 0.826 line. If price closes well below it, the zone is weakening.
4. Wait for the TRIGGER: the break back above the last swing high.
5. Plan the trade: stop under the swing low (or a tighter rule you prefer), target at the swing high.
6. Size the position by the distance to the stop. On weekly zones that distance can be large, so risk a small, fixed amount per trade.
Tips
• Weekly zones built on large swings are the most reliable. Daily zones on small swings get broken far more often.
• A breakout on above-average volume is more convincing than one on light volume.
• Check earnings dates: a gap can jump straight through a stop.
────────────────────────
9. SETTINGS
────────────────────────
• Candles to confirm a swing (default 5)
• Active zones kept per side (default 3)
• Fib levels: zone top 0.618, institutional / smart money line 0.786, smart money bottom 0.826
• Show weekly zones on lower timeframes · show daily zones on intraday charts
• Show sell zones · only the zone closest to price · label the swing high and low
• TRIGGER: bars allowed after the touch, swing size for the break
• Colors, fill transparency and label size
────────────────────────
DISCLAIMER
This indicator is for education and research. It reads past price data and does arithmetic; it does not predict the future and is not financial advice. Zones fail, signals can be wrong, and you can lose money. Make your own decisions and manage your risk.

Disclaimer
The information and publications are not meant to be, and do not constitute, financial, investment, trading, or other types of advice or recommendations supplied or endorsed by TradingView. Read more in the Terms of Use.
Disclaimer
The information and publications are not meant to be, and do not constitute, financial, investment, trading, or other types of advice or recommendations supplied or endorsed by TradingView. Read more in the Terms of Use.