OPEN-SOURCE SCRIPT
[Core Convexity] SMT Divergences
## Description
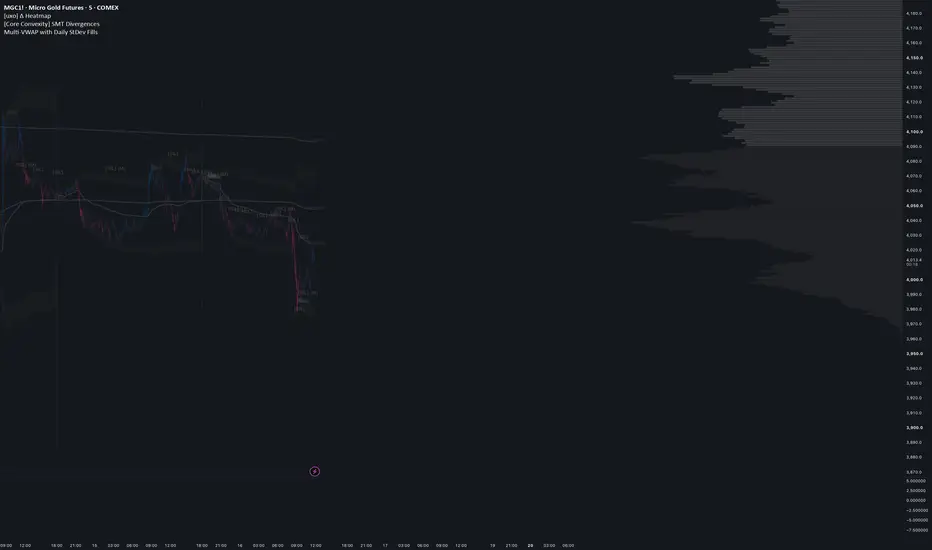
The SMT Divergences indicator is a comprehensive tool designed to detect and manage Smart Money Tool (SMT) divergences across multiple assets directly on your primary chart. SMT divergence is a classic concept used to identify institutional accumulation or distribution by revealing a lack of correlation between highly correlated assets (such as NQ, ES, and YM, or Gold and Silver) at key structural swing points.
This script automates the detection process, filters out duplicate signals, and tracks mitigation (when an SMT structure is broken or invalidated by price action) to keep your charts clean and actionable.
### Key Features
* **Automatic Asset Pairing:** Detects the root symbol of your current chart and automatically pulls data for the most relevant correlated instruments. For example, if you are viewing NQ, it will automatically check ES and YM. It also features a dedicated "No YM" mode to simplify index correlation down to NQ and ES exclusively.
* **Custom Asset Input:** Switch the selection mode to "Custom" to manually input any two symbols you wish to compare against your primary chart.
* **Dual-Layer Detection:** The script scans both immediate pivot points and structural swings (Highs/Lows) to provide both near-term and macro SMT identification.
* **Dynamic Mitigation Stack:** When price invalidates an SMT level, the indicator can immediately remove the visual lines or keep them on the chart for a specified expiration window with a configurable tag to track historical structural breaches.
* **Advanced Merging Logic:** To eliminate chart clutter, the script includes options to merge duplicate rays triggering on the same candle, as well as merging same-origin SMTs into a single combined projection point.
---
## How It Works
An SMT Divergence occurs when one asset fails to confirm a new swing high or low made by a correlated asset:
* **Bearish SMT:** The primary asset fails to make a higher high while the correlated asset successfully drives to a higher high, indicating underlying weakness.
* **Bullish SMT:** The primary asset fails to make a lower low while the correlated asset successfully drives to a lower low, indicating underlying strength.
The script runs a safe lookback sequence up to 450 bars to find matching historical pivot structures, compares the relationship between the primary chart and your secondary/tertiary assets, and plots precision lines directly between the corresponding structural points.
---
## Settings and Inputs
### System
* **Real-Time Detection:** When enabled, calculations update dynamically on the live, open bar. When disabled, signals confirm strictly on the close of the candle.
* **Merge Duplicate Rays:** If both tracked assets trigger an SMT divergence on the exact same bar, this option condenses them into a single line with a combined text label.
* **Merge Same-Origin SMTs:** Combines multiple SMT lines originating from the exact same candle, extending the line to the furthest matching historical point and appending an (M) tag.
* **Enable Structure SMT:** Expands the algorithm to look for structural pivot failures in addition to immediate, strict candle-to-candle alignment.
* **Lookback:** Determines how many historical bars the script will scan to find a matching structural pivot point (capped safely up to 500 bars).
* **Min Bars for Line/Label:** Configures the strict visual threshold required before rendering a line or a text label to screen, filtering out negligible, noise-level divergences.
### Broken SMT Mitigation
* **Remove Broken SMTs:** Activates the garbage collection system to handle lines when price violates the divergence level.
* **Bars to Keep After Invalidation:** Determines how long a broken SMT line remains visible on your chart before deletion. Set this to 0 for immediate visual removal.
* **Show (X) Tag on Invalidated:** Appends an (X) character to the text labels of broken levels during their expiration window.
* **Mitigation Logic:** Choose between "Pair Only (Strict)" which invalidates the line if the primary chart and the specific asset break structure, or "All Connected (Global)" which requires all three assets to breach the level before declaring an invalidation.
### Asset Selection and Styling
* **Asset Selection Mode:** Toggle between Automatic, Automatic (No YM), or Custom routing.
* **Check Mode:** Options include "Strict" (where bullish lines check highs and bearish lines check lows) or "Both High & Low" for unrestricted pivot mapping.
* **Styling Groups:** Fully customize visibility, font sizes, colors, line widths, and line styles (Solid, Dashed, Dotted) independently for both Asset 1 and Asset 2 configurations.
Open-source script
In true TradingView spirit, the creator of this script has made it open-source, so that traders can review and verify its functionality. Kudos to the author! While you can use it for free, remember that republishing the code is subject to our House Rules.

Disclaimer
The information and publications are not meant to be, and do not constitute, financial, investment, trading, or other types of advice or recommendations supplied or endorsed by TradingView. Read more in the Terms of Use.
Open-source script
In true TradingView spirit, the creator of this script has made it open-source, so that traders can review and verify its functionality. Kudos to the author! While you can use it for free, remember that republishing the code is subject to our House Rules.
Disclaimer
The information and publications are not meant to be, and do not constitute, financial, investment, trading, or other types of advice or recommendations supplied or endorsed by TradingView. Read more in the Terms of Use.