OPEN-SOURCE SCRIPT
Market Order Bubbles by LZ (inspired by Leviathan)
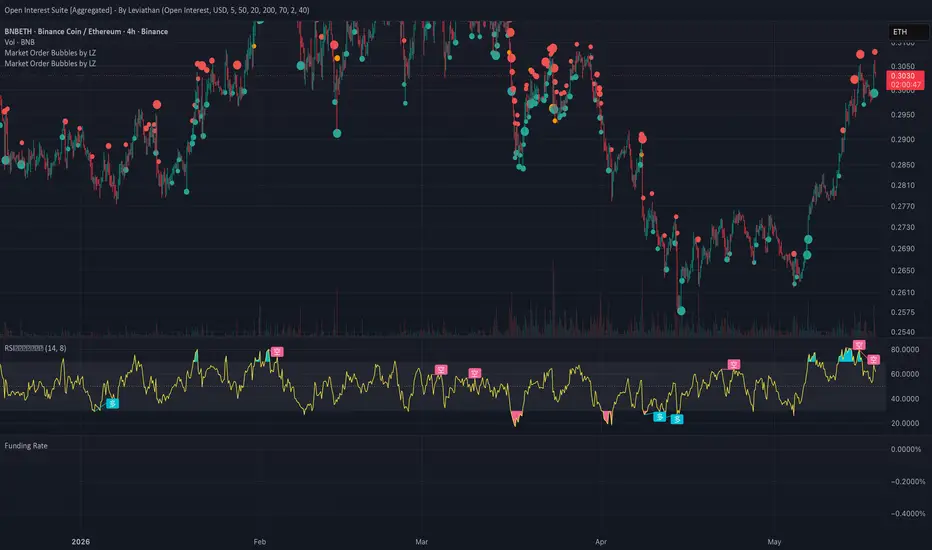
Market Order Bubbles (inspired by Leviathan's original work) visualizes surges
in aggressive buying and selling activity, estimated from OHLCV data using a
simulated CVD approach. Use it as a reversal tool or to monitor real-time order
flow dynamics.
HOW TO READ THE BUBBLES
● Green bubble (below bar) — aggressive buying surge, price advanced effectively
→ neutral to bullish continuation
● Red bubble (above bar) — aggressive selling surge, price declined effectively
→ neutral to bearish continuation
● Orange bubble (below bar) — aggressive buying, but price failed to advance
→ buyer absorption / exhaustion → look for short
● Orange bubble (above bar) — aggressive selling, but price failed to decline
→ seller absorption / exhaustion → look for long
Bubble size reflects surge intensity: small / medium / large.
Only the dominant side is shown per bar (buy or sell volume must exceed the
other by at least 20%), eliminating ambiguous signals on high-volume two-sided
candles.
KEY DIFFERENCES FROM THE ORIGINAL
1. Percentile thresholds instead of EMA + StdDev
Volume is right-skewed. A single spike inflates standard deviation and
suppresses signals for many bars after. Rolling percentiles (90/95/99th)
are immune to this distortion.
2. Exhaustion vs. continuation detection (orange bubbles)
The original treats all bubbles as contrarian signals. This version
distinguishes between continuation flow (price moves with the surge) and
exhaustion / absorption (price fails to follow), giving each bubble a
clearer directional context.
3. Tiny-range bar protection
Bars with range < 0.1 × ATR(14) are skipped. Near-doji candles produce
unstable buy/sell volume estimates that can generate false signals.
4. Dominant-side filter
When buy and sell volume are close in magnitude, no bubble is shown.
Only a clear directional imbalance (≥ 20% edge) triggers a signal.
SETTINGS
Percentile Window — lookback length for threshold calculation (default 200)
Threshold 1/2/3 — percentile levels for small/medium/large bubbles
Tiny Range Filter — minimum bar range as ATR multiple (default 0.1)
Exhaustion Threshold — price efficiency cutoff for orange bubble (default 0.35)
lower close efficiency = buyer/seller failed to push price
TIPS
• Orange bubbles at swing highs/lows are the highest-probability signals.
• Consecutive same-color bubbles during a trend = continuation, not reversal.
• On lower timeframes (≤ 5m), reduce the percentile window to 100 for faster
adaptation to recent volume conditions.
• Pair with the companion Net Delta panel for a continuous view of buy/sell
pressure across all bars.
CREDITS
This indicator was built entirely with Claude Code as an experiment in
AI-assisted Pine Script development. All credit for the original concept
goes to Leviathan — this is simply a tribute and a tinkerer's exploration.
in aggressive buying and selling activity, estimated from OHLCV data using a
simulated CVD approach. Use it as a reversal tool or to monitor real-time order
flow dynamics.
HOW TO READ THE BUBBLES
● Green bubble (below bar) — aggressive buying surge, price advanced effectively
→ neutral to bullish continuation
● Red bubble (above bar) — aggressive selling surge, price declined effectively
→ neutral to bearish continuation
● Orange bubble (below bar) — aggressive buying, but price failed to advance
→ buyer absorption / exhaustion → look for short
● Orange bubble (above bar) — aggressive selling, but price failed to decline
→ seller absorption / exhaustion → look for long
Bubble size reflects surge intensity: small / medium / large.
Only the dominant side is shown per bar (buy or sell volume must exceed the
other by at least 20%), eliminating ambiguous signals on high-volume two-sided
candles.
KEY DIFFERENCES FROM THE ORIGINAL
1. Percentile thresholds instead of EMA + StdDev
Volume is right-skewed. A single spike inflates standard deviation and
suppresses signals for many bars after. Rolling percentiles (90/95/99th)
are immune to this distortion.
2. Exhaustion vs. continuation detection (orange bubbles)
The original treats all bubbles as contrarian signals. This version
distinguishes between continuation flow (price moves with the surge) and
exhaustion / absorption (price fails to follow), giving each bubble a
clearer directional context.
3. Tiny-range bar protection
Bars with range < 0.1 × ATR(14) are skipped. Near-doji candles produce
unstable buy/sell volume estimates that can generate false signals.
4. Dominant-side filter
When buy and sell volume are close in magnitude, no bubble is shown.
Only a clear directional imbalance (≥ 20% edge) triggers a signal.
SETTINGS
Percentile Window — lookback length for threshold calculation (default 200)
Threshold 1/2/3 — percentile levels for small/medium/large bubbles
Tiny Range Filter — minimum bar range as ATR multiple (default 0.1)
Exhaustion Threshold — price efficiency cutoff for orange bubble (default 0.35)
lower close efficiency = buyer/seller failed to push price
TIPS
• Orange bubbles at swing highs/lows are the highest-probability signals.
• Consecutive same-color bubbles during a trend = continuation, not reversal.
• On lower timeframes (≤ 5m), reduce the percentile window to 100 for faster
adaptation to recent volume conditions.
• Pair with the companion Net Delta panel for a continuous view of buy/sell
pressure across all bars.
CREDITS
This indicator was built entirely with Claude Code as an experiment in
AI-assisted Pine Script development. All credit for the original concept
goes to Leviathan — this is simply a tribute and a tinkerer's exploration.
Open-source script
In true TradingView spirit, the creator of this script has made it open-source, so that traders can review and verify its functionality. Kudos to the author! While you can use it for free, remember that republishing the code is subject to our House Rules.

Disclaimer
The information and publications are not meant to be, and do not constitute, financial, investment, trading, or other types of advice or recommendations supplied or endorsed by TradingView. Read more in the Terms of Use.
Open-source script
In true TradingView spirit, the creator of this script has made it open-source, so that traders can review and verify its functionality. Kudos to the author! While you can use it for free, remember that republishing the code is subject to our House Rules.
Disclaimer
The information and publications are not meant to be, and do not constitute, financial, investment, trading, or other types of advice or recommendations supplied or endorsed by TradingView. Read more in the Terms of Use.