OPEN-SOURCE SCRIPT
Combined Market Breadth Table
Overview
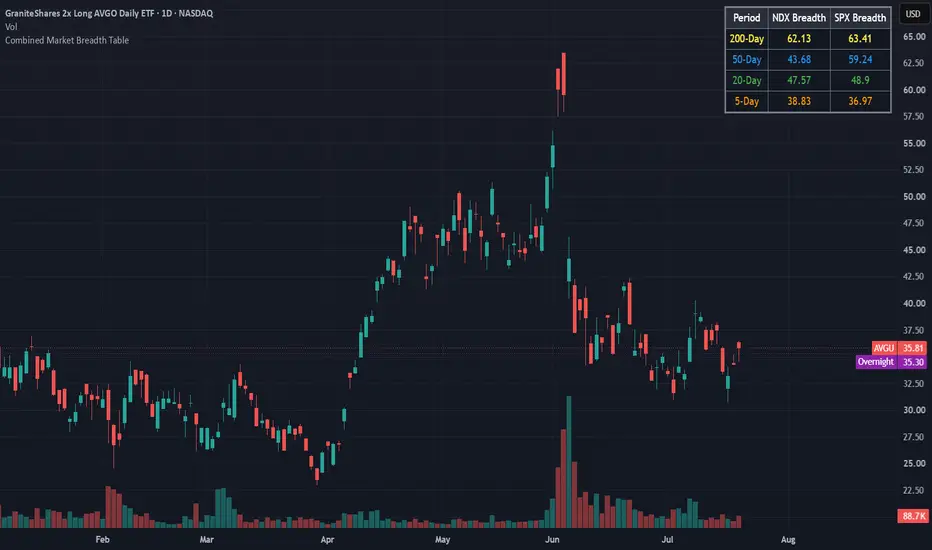
Combined Market Breadth Table is an overlay indicator that brings key market breadth data directly onto your chart in a clean, compact visual display. It tracks the percentage of stocks trading above major moving averages across two of the most heavily watched benchmarks: the Nasdaq 100 (NDX) and the S&P 500 (SPX).
Instead of clogging your screen with multiple lower-pane indicators, this script compiles short-term, medium-term, and long-term breadth metrics into a single table anchored to the top-right corner of your chart.
Key Features
Multi-Timeframe Moving Average Tracking: Displays the percentage of stocks trading above their 200-day, 50-day, 20-day, and 5-day moving averages simultaneously.
Dual-Index Comparison: Tracks both the Nasdaq 100 (NDX) and S&P 500 (SPX) side-by-side to easily spot divergence between tech heavyweights and the broader market.
Color-Coded Rows: Each moving average timeframe uses a distinct, color-coded text palette for quick scanning:
🟡 200-Day (Yellow): Macro / long-term structural trend.
🔵 50-Day (Blue): Intermediate trend.
🟢 20-Day (Green): Short-term trend.
🟠 5-Day (Orange): Ultra-short-term / momentum pulse.
Non-Intrusive Design: Renders only on the latest bar inside a dark, framed table box in the top-right corner, leaving your price action uncluttered.
Combined Market Breadth Table is an overlay indicator that brings key market breadth data directly onto your chart in a clean, compact visual display. It tracks the percentage of stocks trading above major moving averages across two of the most heavily watched benchmarks: the Nasdaq 100 (NDX) and the S&P 500 (SPX).
Instead of clogging your screen with multiple lower-pane indicators, this script compiles short-term, medium-term, and long-term breadth metrics into a single table anchored to the top-right corner of your chart.
Key Features
Multi-Timeframe Moving Average Tracking: Displays the percentage of stocks trading above their 200-day, 50-day, 20-day, and 5-day moving averages simultaneously.
Dual-Index Comparison: Tracks both the Nasdaq 100 (NDX) and S&P 500 (SPX) side-by-side to easily spot divergence between tech heavyweights and the broader market.
Color-Coded Rows: Each moving average timeframe uses a distinct, color-coded text palette for quick scanning:
🟡 200-Day (Yellow): Macro / long-term structural trend.
🔵 50-Day (Blue): Intermediate trend.
🟢 20-Day (Green): Short-term trend.
🟠 5-Day (Orange): Ultra-short-term / momentum pulse.
Non-Intrusive Design: Renders only on the latest bar inside a dark, framed table box in the top-right corner, leaving your price action uncluttered.
Open-source script
In true TradingView spirit, the creator of this script has made it open-source, so that traders can review and verify its functionality. Kudos to the author! While you can use it for free, remember that republishing the code is subject to our House Rules.

Disclaimer
The information and publications are not meant to be, and do not constitute, financial, investment, trading, or other types of advice or recommendations supplied or endorsed by TradingView. Read more in the Terms of Use.
Open-source script
In true TradingView spirit, the creator of this script has made it open-source, so that traders can review and verify its functionality. Kudos to the author! While you can use it for free, remember that republishing the code is subject to our House Rules.
Disclaimer
The information and publications are not meant to be, and do not constitute, financial, investment, trading, or other types of advice or recommendations supplied or endorsed by TradingView. Read more in the Terms of Use.