OPEN-SOURCE SCRIPT
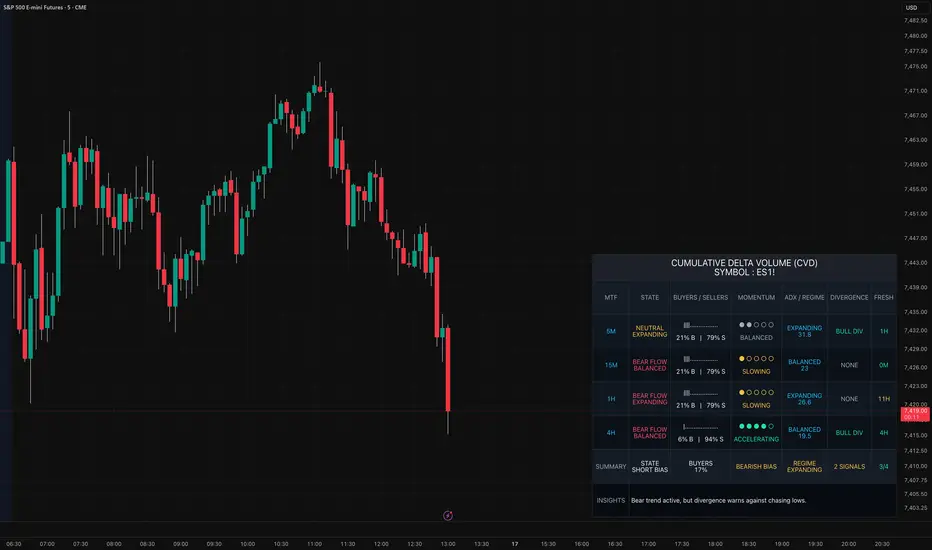
CVD MTF Dashboard with Insights
The hardest part about Cumulative Volume Delta isn’t finding a CVD indicator.
It’s actually understanding what the data is trying to say before price punishes you for misunderstanding it.
Most traders who first encounter CVD quickly realize the same thing:
That’s where this dashboard separates itself from typical CVD tools.
Instead of simply plotting delta and forcing the user to “figure it out,” this system acts more like a real-time market interpreter — translating complex participation behavior into structured, readable context that traders can immediately act on.
At its core, the dashboard combines:
But the real innovation is not any single component.
It’s the way the information is organized into a decision-support framework that dramatically lowers the learning curve of CVD interpretation while still remaining advanced enough for experienced traders.
The dashboard doesn’t just tell you:
“Buyers are active.”
It tells you things like:
That is an enormous difference.
Most CVD tools leave inexperienced traders staring at squiggly lines trying to guess what matters.
This dashboard transforms that complexity into readable market structure.
The INSIGHTS engine is arguably the standout feature.
Rather than forcing traders to manually interpret conflicting signals, the system synthesizes
multiple layers of market behavior into plain-English contextual guidance such as:
This is where the indicator begins to feel less like a traditional study and more like a professional-grade market intelligence panel.
Another standout feature is the emphasis on freshness.
Many indicators can identify trend direction.
Very few can communicate whether the move is still developing or already becoming stale.
By tracking the age and recency of directional participation across multiple timeframes, the dashboard helps traders avoid one of the most common retail mistakes:
entering trends after the highest-probability portion of the move has already occurred.
The visual design also deserves recognition.
Rather than cluttering the screen with overwhelming oscillator noise, the interface presents institutional-style information architecture:
The result is an indicator that feels surprisingly approachable despite the sophistication under the hood.
For newer traders, it makes CVD understandable.
For experienced traders, it makes CVD actionable.
And that combination is rare.
In a market flooded with recycled oscillators and cosmetic overlays, this dashboard stands out because it solves a real problem:
It bridges the gap between raw order-flow complexity and practical decision-making.
This is the kind of tool that feels less like another indicator…
and more like having a professional market interpreter sitting beside you during live trading.
It’s actually understanding what the data is trying to say before price punishes you for misunderstanding it.
Most traders who first encounter CVD quickly realize the same thing:
- The raw data is powerful…
- But interpreting it in real time is difficult.
- Especially across multiple timeframes.
- Especially during transitions, traps, divergences, and session rotations.
That’s where this dashboard separates itself from typical CVD tools.
Instead of simply plotting delta and forcing the user to “figure it out,” this system acts more like a real-time market interpreter — translating complex participation behavior into structured, readable context that traders can immediately act on.
At its core, the dashboard combines:
- Multi-timeframe CVD flow analysis
- Buyer vs seller participation modeling
- Momentum acceleration detection
- ADX regime filtering
- Divergence recognition
- Trend freshness analysis
- Context-aware market insights
But the real innovation is not any single component.
It’s the way the information is organized into a decision-support framework that dramatically lowers the learning curve of CVD interpretation while still remaining advanced enough for experienced traders.
The dashboard doesn’t just tell you:
“Buyers are active.”
It tells you things like:
- Whether participation is expanding or fading
- Whether momentum is accelerating or slowing
- Whether lower timeframes are leading higher timeframes
- Whether the move is fresh or becoming exhausted
- Whether divergence warns against chasing
- Whether conditions favor continuation, patience, or caution
That is an enormous difference.
Most CVD tools leave inexperienced traders staring at squiggly lines trying to guess what matters.
This dashboard transforms that complexity into readable market structure.
The INSIGHTS engine is arguably the standout feature.
Rather than forcing traders to manually interpret conflicting signals, the system synthesizes
multiple layers of market behavior into plain-English contextual guidance such as:
- “Strong bullish participation. CVD supports long continuation setups.”
- “Bear trend active, but freshness is fading. Avoid chasing lows.”
- “Participation is weak and rotational. Patience favored.”
- “Divergence active. Watch for traps, failed continuation, or reversal pressure.”
This is where the indicator begins to feel less like a traditional study and more like a professional-grade market intelligence panel.
Another standout feature is the emphasis on freshness.
Many indicators can identify trend direction.
Very few can communicate whether the move is still developing or already becoming stale.
By tracking the age and recency of directional participation across multiple timeframes, the dashboard helps traders avoid one of the most common retail mistakes:
entering trends after the highest-probability portion of the move has already occurred.
The visual design also deserves recognition.
Rather than cluttering the screen with overwhelming oscillator noise, the interface presents institutional-style information architecture:
- Clean state classifications
- Structured momentum visualization
- Simplified buyer/seller participation bars
- Multi-timeframe alignment summaries
- Minimalistic premium styling
- Readable divergence alerts
- Clear regime identification
The result is an indicator that feels surprisingly approachable despite the sophistication under the hood.
For newer traders, it makes CVD understandable.
For experienced traders, it makes CVD actionable.
And that combination is rare.
In a market flooded with recycled oscillators and cosmetic overlays, this dashboard stands out because it solves a real problem:
It bridges the gap between raw order-flow complexity and practical decision-making.
This is the kind of tool that feels less like another indicator…
and more like having a professional market interpreter sitting beside you during live trading.
Open-source script
In true TradingView spirit, the creator of this script has made it open-source, so that traders can review and verify its functionality. Kudos to the author! While you can use it for free, remember that republishing the code is subject to our House Rules.

Disclaimer
The information and publications are not meant to be, and do not constitute, financial, investment, trading, or other types of advice or recommendations supplied or endorsed by TradingView. Read more in the Terms of Use.
Open-source script
In true TradingView spirit, the creator of this script has made it open-source, so that traders can review and verify its functionality. Kudos to the author! While you can use it for free, remember that republishing the code is subject to our House Rules.
Disclaimer
The information and publications are not meant to be, and do not constitute, financial, investment, trading, or other types of advice or recommendations supplied or endorsed by TradingView. Read more in the Terms of Use.