OPEN-SOURCE SCRIPT
Complex Esco Theory
WHAT IS ESCO THEORY?
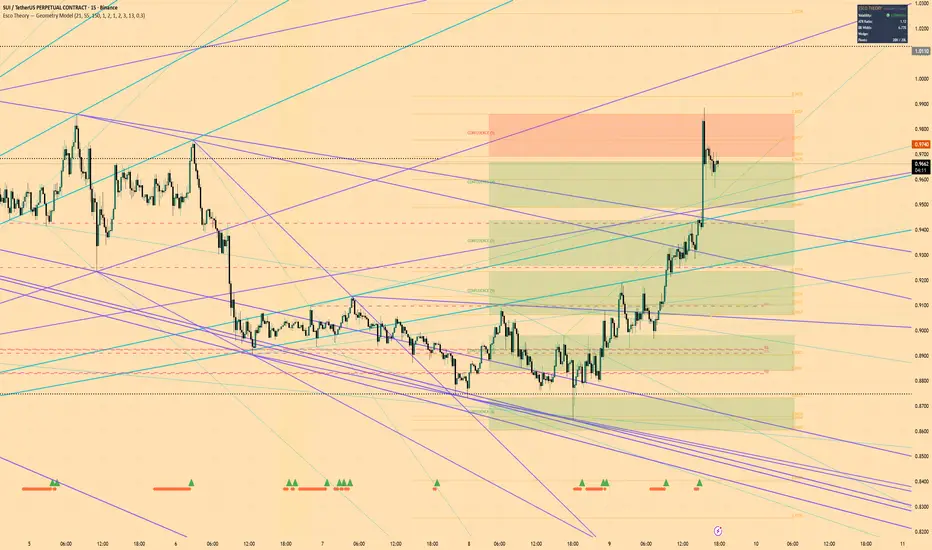
Esco Theory is a discretionary trading framework built on the belief that markets are liquidity-seeking systems governed by geometric structure, compression-expansion cycles, and pattern repetition across timeframes. This indicator automates the geometric mapping component of the framework — the network of diagonal rails, horizontal levels, and confluence zones that identify where the market is most likely to produce significant reactions.
The framework was developed for cryptocurrency perpetual futures (primarily BTC) but works on any liquid market.
━━━━━━━━━━━━━━━━━━━━━━━━━━━━━━━
WHAT THIS INDICATOR DOES
🔷 GEOMETRIC RAILS
Automatically detects pivot highs and lows at two significance levels (standard and major cycle) and constructs a network of diagonal trendlines connecting them:
• Standard diagonal rails connecting consecutive swing highs and swing lows
• Cross-connect rails linking swing highs to swing lows for opposing structural lines
• Major cycle rails connecting the most significant pivots on the chart
• Fan structure from the cycle bottom (lowest major low) radiating upward through each major high — replicating the ascending rail fan used in Esco's macro analysis
• Descending fan from the cycle top (highest major high) through each major low
The result is a layered geometric grid where intersections of multiple rails identify high-probability reaction zones.
🟧 HORIZONTAL LEVELS
Plots horizontal support and resistance at every detected major pivot price with optional price labels. Standard swing pivots are shown as more subtle dotted horizontals. These represent the structural levels where liquidity accumulates and where the market has historically reacted.
🟢🔴 CONFLUENCE ZONES
Scans all detected price levels (major pivots + standard swing pivots) and identifies clusters where 3 or more levels fall within a configurable percentage range. These clusters are highlighted as shaded boxes:
• Green zones = confluence below current price (potential support)
• Red zones = confluence above current price (potential resistance)
Confluence zones are the highest-conviction areas in the framework — where multiple independent structural reasons converge to suggest a significant market reaction.
🟡 COMPRESSION DETECTION
Identifies periods of volatility compression using three methods:
• ATR Ratio (fast ATR / slow ATR) — when the ratio drops below 0.6, the market is compressing
• Bollinger Band Squeeze — when Bollinger Bands contract inside Keltner Channels, a squeeze is active
• Wedge Detection — when recent pivot highs are making lower highs AND recent pivot lows are making higher lows, a converging wedge structure is forming
Visual signals:
• Yellow background shading during compression phases
• Orange diamonds at the bottom of the chart during active squeezes
• Green triangle when the squeeze fires (expansion begins)
• Dashed yellow wedge lines showing the converging structure
🩷 LIQUIDITY LEVELS (Equal Highs & Equal Lows)
Detects instances where two or more swing points form at nearly identical price levels. These "equal highs" (EQH) and "equal lows" (EQL) represent concentrated pools of resting stop-loss orders — the liquidity targets that price is drawn toward. Marked with pink dashed lines.
📊 INFO PANEL
Real-time status table in the top-right corner showing:
• Current volatility state (SQUEEZE / COMPRESSING / EXPANDING)
• ATR Ratio value
• Bollinger Band Width percentage
• Wedge status (active or inactive)
• Detected pivot counts
━━━━━━━━━━━━━━━━━━━━━━━━━━━━━━━
HOW TO USE IT
1. IDENTIFY THE ZONE — Look for areas where multiple geometric rails intersect AND a confluence zone box appears. These are the framework's highest-probability reaction areas.
2. WAIT FOR COMPRESSION — When price reaches a high-confluence zone and the indicator shows compression (yellow background, squeeze diamonds, or visible wedge), a significant move is building.
3. WATCH FOR THE TRIGGER — The squeeze fire signal (green triangle) indicates the compression is releasing. Combined with a confluence zone, this is the framework's primary trade signal.
4. MAP YOUR TARGETS — Use the horizontal levels and liquidity markers (EQH/EQL) above and below the current price as structural targets. Price moves between liquidity pools.
5. USE MULTIPLE TIMEFRAMES — Apply the indicator on weekly/daily for macro structure and 4H/1H for tactical setups. When the same confluence zone appears across timeframes, conviction is highest.
━━━━━━━━━━━━━━━━━━━━━━━━━━━━━━━
KEY SETTINGS
Swing Detection
• Pivot Lookback Length (default 21) — Controls sensitivity for standard pivots. Lower = more pivots, noisier. Higher = fewer, more significant pivots.
• Major Pivot Lookback (default 55) — Controls the major cycle pivot detection. Increase for higher timeframes.
Geometric Rails
• Rail Extension — How far into the future rails project (in bars)
• Colors and widths for standard vs major rails
• Toggle dashed lines for minor rails to reduce visual clutter
Confluence Detection
• Confluence Threshold % — How close levels must be to cluster (default 2%). Tighten for precision, widen for more zones.
• Min Levels for Confluence — Minimum number of levels in a cluster (default 3). Increase for higher-conviction zones only.
Compression
• Compression Pivot Length — Controls the wedge detection sensitivity
• Background shading toggle
Liquidity
• Equal High/Low Threshold % — How close swing points must be to count as "equal" (default 0.3%)
━━━━━━━━━━━━━━━━━━━━━━━━━━━━━━━
RECOMMENDED SETUPS BY TIMEFRAME
Weekly/Monthly — Set Major Pivot Lookback to 80-100. Focus on the fan structure and horizontal levels for macro cycle mapping.
Daily/4-Hour — Default settings work well. Primary timeframe for identifying ECB (Esco Compression Breakout) setups at confluence zones.
1-Hour/15-Min — Reduce Pivot Lookback to 13-15 and Major Pivot to 34-40. Focus on compression detection and liquidity levels for execution timing.
━━━━━━━━━━━━━━━━━━━━━━━━━━━━━━━
BASED ON ESCO THEORY
This indicator is one component of the broader Esco Theory framework, which also includes:
• The Compression → Expansion Cycle (5-phase model)
• The Esco Compression Breakout (ECB) strategy
• Multi-Timeframe Confluence analysis
• R-Unit risk management system
• Liquidity targeting methodology
The indicator automates the geometric and structural detection. Trade decisions, directional bias, and risk management remain discretionary — as intended by the framework.
━━━━━━━━━━━━━━━━━━━━━━━━━━━━━━━
DISCLAIMER
This indicator is an analytical tool, not financial advice. It does not generate buy/sell signals. All trading involves risk. Use proper risk management and trade only with capital you can afford to lose.
Esco Theory is a discretionary trading framework built on the belief that markets are liquidity-seeking systems governed by geometric structure, compression-expansion cycles, and pattern repetition across timeframes. This indicator automates the geometric mapping component of the framework — the network of diagonal rails, horizontal levels, and confluence zones that identify where the market is most likely to produce significant reactions.
The framework was developed for cryptocurrency perpetual futures (primarily BTC) but works on any liquid market.
━━━━━━━━━━━━━━━━━━━━━━━━━━━━━━━
WHAT THIS INDICATOR DOES
🔷 GEOMETRIC RAILS
Automatically detects pivot highs and lows at two significance levels (standard and major cycle) and constructs a network of diagonal trendlines connecting them:
• Standard diagonal rails connecting consecutive swing highs and swing lows
• Cross-connect rails linking swing highs to swing lows for opposing structural lines
• Major cycle rails connecting the most significant pivots on the chart
• Fan structure from the cycle bottom (lowest major low) radiating upward through each major high — replicating the ascending rail fan used in Esco's macro analysis
• Descending fan from the cycle top (highest major high) through each major low
The result is a layered geometric grid where intersections of multiple rails identify high-probability reaction zones.
🟧 HORIZONTAL LEVELS
Plots horizontal support and resistance at every detected major pivot price with optional price labels. Standard swing pivots are shown as more subtle dotted horizontals. These represent the structural levels where liquidity accumulates and where the market has historically reacted.
🟢🔴 CONFLUENCE ZONES
Scans all detected price levels (major pivots + standard swing pivots) and identifies clusters where 3 or more levels fall within a configurable percentage range. These clusters are highlighted as shaded boxes:
• Green zones = confluence below current price (potential support)
• Red zones = confluence above current price (potential resistance)
Confluence zones are the highest-conviction areas in the framework — where multiple independent structural reasons converge to suggest a significant market reaction.
🟡 COMPRESSION DETECTION
Identifies periods of volatility compression using three methods:
• ATR Ratio (fast ATR / slow ATR) — when the ratio drops below 0.6, the market is compressing
• Bollinger Band Squeeze — when Bollinger Bands contract inside Keltner Channels, a squeeze is active
• Wedge Detection — when recent pivot highs are making lower highs AND recent pivot lows are making higher lows, a converging wedge structure is forming
Visual signals:
• Yellow background shading during compression phases
• Orange diamonds at the bottom of the chart during active squeezes
• Green triangle when the squeeze fires (expansion begins)
• Dashed yellow wedge lines showing the converging structure
🩷 LIQUIDITY LEVELS (Equal Highs & Equal Lows)
Detects instances where two or more swing points form at nearly identical price levels. These "equal highs" (EQH) and "equal lows" (EQL) represent concentrated pools of resting stop-loss orders — the liquidity targets that price is drawn toward. Marked with pink dashed lines.
📊 INFO PANEL
Real-time status table in the top-right corner showing:
• Current volatility state (SQUEEZE / COMPRESSING / EXPANDING)
• ATR Ratio value
• Bollinger Band Width percentage
• Wedge status (active or inactive)
• Detected pivot counts
━━━━━━━━━━━━━━━━━━━━━━━━━━━━━━━
HOW TO USE IT
1. IDENTIFY THE ZONE — Look for areas where multiple geometric rails intersect AND a confluence zone box appears. These are the framework's highest-probability reaction areas.
2. WAIT FOR COMPRESSION — When price reaches a high-confluence zone and the indicator shows compression (yellow background, squeeze diamonds, or visible wedge), a significant move is building.
3. WATCH FOR THE TRIGGER — The squeeze fire signal (green triangle) indicates the compression is releasing. Combined with a confluence zone, this is the framework's primary trade signal.
4. MAP YOUR TARGETS — Use the horizontal levels and liquidity markers (EQH/EQL) above and below the current price as structural targets. Price moves between liquidity pools.
5. USE MULTIPLE TIMEFRAMES — Apply the indicator on weekly/daily for macro structure and 4H/1H for tactical setups. When the same confluence zone appears across timeframes, conviction is highest.
━━━━━━━━━━━━━━━━━━━━━━━━━━━━━━━
KEY SETTINGS
Swing Detection
• Pivot Lookback Length (default 21) — Controls sensitivity for standard pivots. Lower = more pivots, noisier. Higher = fewer, more significant pivots.
• Major Pivot Lookback (default 55) — Controls the major cycle pivot detection. Increase for higher timeframes.
Geometric Rails
• Rail Extension — How far into the future rails project (in bars)
• Colors and widths for standard vs major rails
• Toggle dashed lines for minor rails to reduce visual clutter
Confluence Detection
• Confluence Threshold % — How close levels must be to cluster (default 2%). Tighten for precision, widen for more zones.
• Min Levels for Confluence — Minimum number of levels in a cluster (default 3). Increase for higher-conviction zones only.
Compression
• Compression Pivot Length — Controls the wedge detection sensitivity
• Background shading toggle
Liquidity
• Equal High/Low Threshold % — How close swing points must be to count as "equal" (default 0.3%)
━━━━━━━━━━━━━━━━━━━━━━━━━━━━━━━
RECOMMENDED SETUPS BY TIMEFRAME
Weekly/Monthly — Set Major Pivot Lookback to 80-100. Focus on the fan structure and horizontal levels for macro cycle mapping.
Daily/4-Hour — Default settings work well. Primary timeframe for identifying ECB (Esco Compression Breakout) setups at confluence zones.
1-Hour/15-Min — Reduce Pivot Lookback to 13-15 and Major Pivot to 34-40. Focus on compression detection and liquidity levels for execution timing.
━━━━━━━━━━━━━━━━━━━━━━━━━━━━━━━
BASED ON ESCO THEORY
This indicator is one component of the broader Esco Theory framework, which also includes:
• The Compression → Expansion Cycle (5-phase model)
• The Esco Compression Breakout (ECB) strategy
• Multi-Timeframe Confluence analysis
• R-Unit risk management system
• Liquidity targeting methodology
The indicator automates the geometric and structural detection. Trade decisions, directional bias, and risk management remain discretionary — as intended by the framework.
━━━━━━━━━━━━━━━━━━━━━━━━━━━━━━━
DISCLAIMER
This indicator is an analytical tool, not financial advice. It does not generate buy/sell signals. All trading involves risk. Use proper risk management and trade only with capital you can afford to lose.
Open-source script
In true TradingView spirit, the creator of this script has made it open-source, so that traders can review and verify its functionality. Kudos to the author! While you can use it for free, remember that republishing the code is subject to our House Rules.

Disclaimer
The information and publications are not meant to be, and do not constitute, financial, investment, trading, or other types of advice or recommendations supplied or endorsed by TradingView. Read more in the Terms of Use.
Open-source script
In true TradingView spirit, the creator of this script has made it open-source, so that traders can review and verify its functionality. Kudos to the author! While you can use it for free, remember that republishing the code is subject to our House Rules.
Disclaimer
The information and publications are not meant to be, and do not constitute, financial, investment, trading, or other types of advice or recommendations supplied or endorsed by TradingView. Read more in the Terms of Use.