OPEN-SOURCE SCRIPT
nichoxbt's NUPL ratio
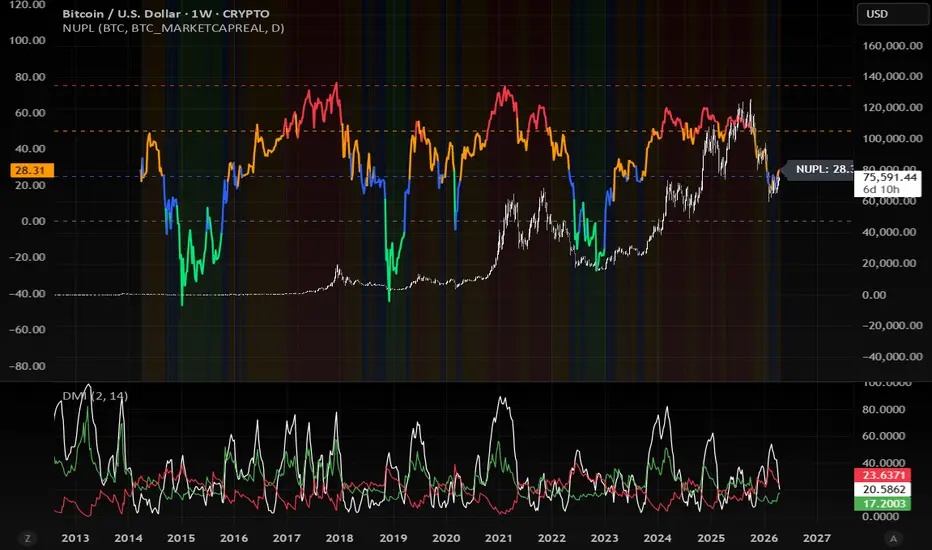
BTC NUPL (Net Unrealized Profit/Loss) is an on-chain indicator that measures the overall profitability of Bitcoin holders by comparing Market Cap and Realized Cap.
It provides a clear view of market cycles by showing whether investors are, on average, in profit or loss — making it a powerful tool for identifying long-term tops and bottoms.
NUPL is calculated as:
- Market Cap → current value of all BTC
- Realized Cap → aggregate cost basis of all BTC
By comparing the two, the indicator reveals the level of unrealized profit in the market.
Explanation:
- Green = Capitulation/Pain zone, perfect for accumulating because macro bottom is likely to form
- Blue = Hope/Slow recovery, good for accumulating since its not likely to bottom yet
- Orange = Belief/Growth, start scalling out slowly because macro top is near
- Red = Euphoria/Greed, its highly recommended to take profits because macro top is likely to form
Conclusion:
Green, Blue = Buy (Bear market bottom)
Orange, Red = Sell (Bull market top)
Important Notes
This is a macro-level indicator, not designed for short-term trading signals
Best used for cycle analysis and long-term positioning
Works strongest when combined with other tools and market context
It provides a clear view of market cycles by showing whether investors are, on average, in profit or loss — making it a powerful tool for identifying long-term tops and bottoms.
NUPL is calculated as:
- Market Cap → current value of all BTC
- Realized Cap → aggregate cost basis of all BTC
By comparing the two, the indicator reveals the level of unrealized profit in the market.
Explanation:
- Green = Capitulation/Pain zone, perfect for accumulating because macro bottom is likely to form
- Blue = Hope/Slow recovery, good for accumulating since its not likely to bottom yet
- Orange = Belief/Growth, start scalling out slowly because macro top is near
- Red = Euphoria/Greed, its highly recommended to take profits because macro top is likely to form
Conclusion:
Green, Blue = Buy (Bear market bottom)
Orange, Red = Sell (Bull market top)
Important Notes
This is a macro-level indicator, not designed for short-term trading signals
Best used for cycle analysis and long-term positioning
Works strongest when combined with other tools and market context
Open-source script
In true TradingView spirit, the creator of this script has made it open-source, so that traders can review and verify its functionality. Kudos to the author! While you can use it for free, remember that republishing the code is subject to our House Rules.

Disclaimer
The information and publications are not meant to be, and do not constitute, financial, investment, trading, or other types of advice or recommendations supplied or endorsed by TradingView. Read more in the Terms of Use.
Open-source script
In true TradingView spirit, the creator of this script has made it open-source, so that traders can review and verify its functionality. Kudos to the author! While you can use it for free, remember that republishing the code is subject to our House Rules.
Disclaimer
The information and publications are not meant to be, and do not constitute, financial, investment, trading, or other types of advice or recommendations supplied or endorsed by TradingView. Read more in the Terms of Use.