OPEN-SOURCE SCRIPT
RSI Pullback Finder Trend-Filtered oversold dips in an up
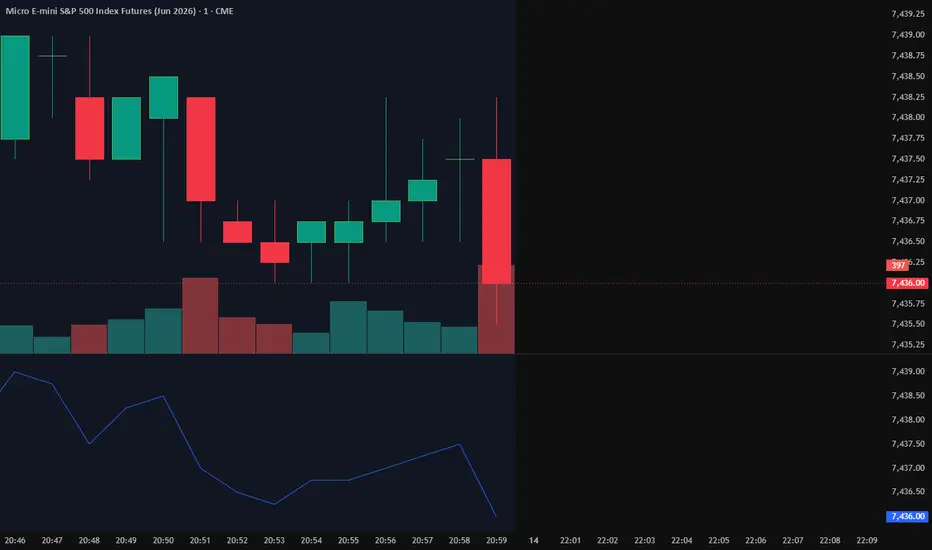
A clean, fully-configurable tool that highlights short-term oversold pullbacks while price is still in an uptrend — the classic "buy the dip in an uptrend" context. Visual signals + alerts. Educational, not financial advice.
RSI(2) Pullback Finder highlights one specific, well-known context: a short-term oversold pullback that happens WHILE price is still in an uptrend. This is the classic Larry-Connors-style "short-term mean reversion inside a longer-term uptrend" idea, turned into a clean visual + alert layer.
WHAT IT MARKS: Trend filter — price above a moving average you choose (default EMA 50). Oversold pullback — a short RSI (default length 2) dropping below a level you choose (default 10). When both are true on the same bar, the bar is shaded and a signal plots. Optional "context cleared" marker shows where the short-term oversold condition has resolved.
EVERYTHING IS CONFIGURABLE: MA type and length, RSI length and source, oversold level, reset level, fast MA, and all display toggles. Defaults are generic textbook values on purpose — tune them to your instrument and timeframe.
HOW TO USE: Treat a signal as "this setup is present right now," then apply your own entry rules, position sizing, and risk management. Use the built-in alerts to scan instead of staring at charts. Works on any symbol or timeframe.
WHAT IT IS NOT: It does not place trades, predict direction, or guarantee anything. It is a visualisation and alert tool. Past behaviour of any pattern does not predict future results. For education and research only — not financial advice, and I am not a financial adviser. Trade your own plan and your own risk.
Open-source — read the code, fork it, adapt it. Feedback welcome in the comments.
RSI(2) Pullback Finder highlights one specific, well-known context: a short-term oversold pullback that happens WHILE price is still in an uptrend. This is the classic Larry-Connors-style "short-term mean reversion inside a longer-term uptrend" idea, turned into a clean visual + alert layer.
WHAT IT MARKS: Trend filter — price above a moving average you choose (default EMA 50). Oversold pullback — a short RSI (default length 2) dropping below a level you choose (default 10). When both are true on the same bar, the bar is shaded and a signal plots. Optional "context cleared" marker shows where the short-term oversold condition has resolved.
EVERYTHING IS CONFIGURABLE: MA type and length, RSI length and source, oversold level, reset level, fast MA, and all display toggles. Defaults are generic textbook values on purpose — tune them to your instrument and timeframe.
HOW TO USE: Treat a signal as "this setup is present right now," then apply your own entry rules, position sizing, and risk management. Use the built-in alerts to scan instead of staring at charts. Works on any symbol or timeframe.
WHAT IT IS NOT: It does not place trades, predict direction, or guarantee anything. It is a visualisation and alert tool. Past behaviour of any pattern does not predict future results. For education and research only — not financial advice, and I am not a financial adviser. Trade your own plan and your own risk.
Open-source — read the code, fork it, adapt it. Feedback welcome in the comments.
Open-source script
In true TradingView spirit, the creator of this script has made it open-source, so that traders can review and verify its functionality. Kudos to the author! While you can use it for free, remember that republishing the code is subject to our House Rules.

Disclaimer
The information and publications are not meant to be, and do not constitute, financial, investment, trading, or other types of advice or recommendations supplied or endorsed by TradingView. Read more in the Terms of Use.
Open-source script
In true TradingView spirit, the creator of this script has made it open-source, so that traders can review and verify its functionality. Kudos to the author! While you can use it for free, remember that republishing the code is subject to our House Rules.
Disclaimer
The information and publications are not meant to be, and do not constitute, financial, investment, trading, or other types of advice or recommendations supplied or endorsed by TradingView. Read more in the Terms of Use.