[DAOL] Volatility (Annualized)
⏺️ What is it?
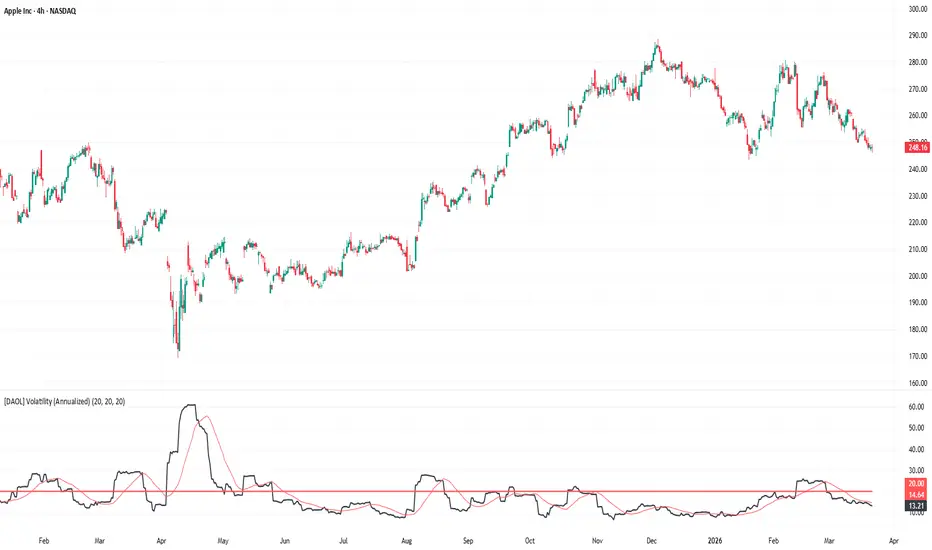
The Volatility (Annualized) indicator measures the degree of price variation over a specific period, projected onto an annual scale. It helps traders quantify market fear, uncertainty, and potential breakout strength using standard deviation.
🔹Black Line (Volatility): Represents the current annualized volatility percentage.
🔹Red Line (Moving Average): A smoothed trend of volatility to identify if the market is becoming more or less active.
🔹Horizontal Red Line (Level): A customizable benchmark (default at 20%) to distinguish between "Quiet" and "High-Volatility" regimes.
⏺️ Indicator นี้คืออะไร?
Volatility (Annualized) คือเครื่องมือวัด "ความแรง" ในการเหวี่ยงของราคา โดยคำนวณจากค่าเบี่ยงเบนมาตรฐาน (Standard Deviation) แล้วปรับให้เป็นค่าความผันผวนต่อปี ช่วยให้เทรดเดอร์เห็นภาพรวมของความเสี่ยงและจังหวะที่ตลาดเริ่มมีการเคลื่อนไหวรุนแรง
🔹เส้นสีดำ (Volatility): ค่าความผันผวนปัจจุบัน (คิดเป็นเปอร์เซ็นต์ต่อปี)
🔹เส้นสีแดง (Moving Average): ค่าเฉลี่ยของความผันผวน เพื่อดูแนวโน้มว่าตลาดเริ่ม "ดุ" หรือ "เงียบ" ลง
🔹เส้นแนวนอนสีแดง (Level): เกณฑ์ตัดสิน (ค่าเริ่มต้นที่ 20%) เพื่อแยกแยะโซนที่ตลาดปกติดังกล่าวกับโซนที่มีความผันผวนสูง
--------------------
⏺️ Why use Volatility?
🔹Measures Market Fear & Greed: High volatility often signals panic or aggressive speculation, while low volatility suggests accumulation or indifference.
🔹Dynamic Risk Management: Helps adjust position sizing; reducing size during high volatility and increasing during low volatility.
🔹Breakout Confirmation: Sudden spikes in the black line often precede or accompany significant price breakouts.
🔹Market Regime Identification: Easily distinguish between a "Trending Market" (High Vol) and a "Ranging Market" (Low Vol)
⏺️ ทำไมต้องใช้?
🔹วัดความกลัวและความโลภ: ความผันผวนสูงมักมาพร้อมกับการตื่นตระหนกหรือการเก็งกำไรที่รุนแรง ส่วนความผันผวนต่ำแสดงถึงช่วงสะสมของหรือตลาดนิ่ง
🔹จัดการความเสี่ยง : ช่วยให้ปรับขนาดไม้เทรด (Position Sizing) ได้เหมาะสม เช่น ลดขนาดไม้เมื่อตลาดแกว่งแรงเพื่อเลี่ยงการโดน Stop Loss
🔹ยืนยันการ Breakout: การที่เส้นสีดำพุ่งขึ้นกระทันหัน มักเป็นตัวคอนเฟิร์มว่าราคาที่ทะลุออกมานั้นมีแรงส่ง (Momentum) จริง
🔹แยกสภาวะตลาด: ช่วยให้เห็นชัดเจนว่าช่วงไหนควรเล่นแบบตามเทรนด์ (Trend Following) หรือช่วงไหนควรเล่นแบบกรอบแคบ (Sideways)
--------------------
⏺️ Who should use it?
🔹Traders who want to understand market conditions before entering trades
🔹Risk Managers: Traders who prioritize capital preservation through dynamic stop-loss levels.
🔹Breakout Traders: Those looking for "Volatility Squeeze" setups before a massive move.
🔹Systematic Traders: Anyone needing a mathematical filter to avoid "choppy" market conditions.
⏺️ เหมาะกับใคร?
🔹 Trader ที่อยากเข้าใจ “สภาพตลาด” ก่อนเข้าเทรด
🔹สายคุมความเสี่ยง: เทรดเดอร์ที่ให้ความสำคัญกับการรักษาเงินทุน โดยใช้ความผันผวนกำหนดจุดตัดขาด
ทุน
🔹สาย Breakout: นักลงทุนที่รอจังหวะ "ตลาดบีบตัว" (Low Vol) ก่อนที่จะเกิดการระเบิดของราคาครั้งใหญ่
🔹นักเทรดระบบ (Systematic): ผู้ที่ต้องการเงื่อนไขทางคณิตศาสตร์เพื่อกรองช่วงที่ตลาดไม่มีทิศทาง (Choppy) ออกไป
--------------------
⏺️ How to use
🔹 Low Volatility (Below Level)
Market is calm → price moves slowly → often indicates consolidation
→ Watch for potential breakout
🔹 High Volatility (Above Level)
Market is active → price swings strongly → trend or panic phase
→ Reduce position size / widen stop loss
🔹 Volatility Expansion
Volatility rising rapidly → potential start of strong move
🔹 Volatility Contraction
Volatility decreasing → market stabilizing → possible base formation
🔹 Vol below MA after spike
Indicates market cooling down after strong movement → Watch for next directional setup
⏺️ วิธีใช้งาน
🔹 Vol ต่ำ (ต่ำกว่าเส้น Level)
ตลาดนิ่ง → ราคาแกว่งแคบ → มักเป็นช่วงสะสม / sideway → รอ breakout
🔹 Vol สูง (สูงกว่าเส้น Level)
ตลาดแรง → ราคาเหวี่ยงแรง → trend หรือ panic → ลดขนาดไม้ / stop กว้างขึ้น
🔹 Vol พุ่งขึ้น (Expansion)
มีโอกาสเกิด move ใหญ่
🔹 Vol ลดลง (Contraction)
ตลาดเริ่มนิ่ง → อาจกำลังสร้างฐาน
🔹 Vol ต่ำกว่า MA หลังจากเคยสูงมาก
ตลาดเริ่มเย็นลง → เตรียมเข้าสู่ phase ใหม่
--------------------
⏺️ Key Features
🔹Annualized Projection: Converts daily price swings into a familiar yearly percentage format.
🔹Trend Following MA: Built-in Moving Average to filter out minor noise in volatility.
🔹Customizable Threshold: Easily adjust the horizontal "Warning Level" to fit different assets (e.g., Stocks vs. Crypto).
⏺️ จุดเด่น
🔹คำนวณแบบรายปี: แปลงการแกว่งรายวันให้เป็นรูปแบบเปอร์เซ็นต์ต่อปีที่เข้าใจง่าย
🔹มีเส้นค่าเฉลี่ยในตัว: ช่วยกรองสัญญาณหลอก (Noise) ของความผันผวน ทำให้เห็นแนวโน้มหลักชัดเจน
🔹ปรับเกณฑ์ได้อิสระ: สามารถปรับเส้น Horizontal Level ให้เหมาะกับสินทรัพย์แต่ละประเภท (เช่น หุ้นไทย vs คริปโต)
--------------------
Disclaimer
🔹This indicator is for educational and informational purposes only.
🔹Volatility does not predict direction, only magnitude. Always use in conjunction with price action.
🔹Indicator นี้ใช้เพื่อการศึกษาเท่านั้น
🔹ความผันผวนบอก "ขนาด" ของการเหวี่ยง แต่ไม่ได้บอก "ทิศทาง" ควรใช้ควบคู่กับการวิเคราะห์แนวโน้มราคาเสมอ
The Volatility (Annualized) indicator measures the degree of price variation over a specific period, projected onto an annual scale. It helps traders quantify market fear, uncertainty, and potential breakout strength using standard deviation.
🔹Black Line (Volatility): Represents the current annualized volatility percentage.
🔹Red Line (Moving Average): A smoothed trend of volatility to identify if the market is becoming more or less active.
🔹Horizontal Red Line (Level): A customizable benchmark (default at 20%) to distinguish between "Quiet" and "High-Volatility" regimes.
⏺️ Indicator นี้คืออะไร?
Volatility (Annualized) คือเครื่องมือวัด "ความแรง" ในการเหวี่ยงของราคา โดยคำนวณจากค่าเบี่ยงเบนมาตรฐาน (Standard Deviation) แล้วปรับให้เป็นค่าความผันผวนต่อปี ช่วยให้เทรดเดอร์เห็นภาพรวมของความเสี่ยงและจังหวะที่ตลาดเริ่มมีการเคลื่อนไหวรุนแรง
🔹เส้นสีดำ (Volatility): ค่าความผันผวนปัจจุบัน (คิดเป็นเปอร์เซ็นต์ต่อปี)
🔹เส้นสีแดง (Moving Average): ค่าเฉลี่ยของความผันผวน เพื่อดูแนวโน้มว่าตลาดเริ่ม "ดุ" หรือ "เงียบ" ลง
🔹เส้นแนวนอนสีแดง (Level): เกณฑ์ตัดสิน (ค่าเริ่มต้นที่ 20%) เพื่อแยกแยะโซนที่ตลาดปกติดังกล่าวกับโซนที่มีความผันผวนสูง
--------------------
⏺️ Why use Volatility?
🔹Measures Market Fear & Greed: High volatility often signals panic or aggressive speculation, while low volatility suggests accumulation or indifference.
🔹Dynamic Risk Management: Helps adjust position sizing; reducing size during high volatility and increasing during low volatility.
🔹Breakout Confirmation: Sudden spikes in the black line often precede or accompany significant price breakouts.
🔹Market Regime Identification: Easily distinguish between a "Trending Market" (High Vol) and a "Ranging Market" (Low Vol)
⏺️ ทำไมต้องใช้?
🔹วัดความกลัวและความโลภ: ความผันผวนสูงมักมาพร้อมกับการตื่นตระหนกหรือการเก็งกำไรที่รุนแรง ส่วนความผันผวนต่ำแสดงถึงช่วงสะสมของหรือตลาดนิ่ง
🔹จัดการความเสี่ยง : ช่วยให้ปรับขนาดไม้เทรด (Position Sizing) ได้เหมาะสม เช่น ลดขนาดไม้เมื่อตลาดแกว่งแรงเพื่อเลี่ยงการโดน Stop Loss
🔹ยืนยันการ Breakout: การที่เส้นสีดำพุ่งขึ้นกระทันหัน มักเป็นตัวคอนเฟิร์มว่าราคาที่ทะลุออกมานั้นมีแรงส่ง (Momentum) จริง
🔹แยกสภาวะตลาด: ช่วยให้เห็นชัดเจนว่าช่วงไหนควรเล่นแบบตามเทรนด์ (Trend Following) หรือช่วงไหนควรเล่นแบบกรอบแคบ (Sideways)
--------------------
⏺️ Who should use it?
🔹Traders who want to understand market conditions before entering trades
🔹Risk Managers: Traders who prioritize capital preservation through dynamic stop-loss levels.
🔹Breakout Traders: Those looking for "Volatility Squeeze" setups before a massive move.
🔹Systematic Traders: Anyone needing a mathematical filter to avoid "choppy" market conditions.
⏺️ เหมาะกับใคร?
🔹 Trader ที่อยากเข้าใจ “สภาพตลาด” ก่อนเข้าเทรด
🔹สายคุมความเสี่ยง: เทรดเดอร์ที่ให้ความสำคัญกับการรักษาเงินทุน โดยใช้ความผันผวนกำหนดจุดตัดขาด
ทุน
🔹สาย Breakout: นักลงทุนที่รอจังหวะ "ตลาดบีบตัว" (Low Vol) ก่อนที่จะเกิดการระเบิดของราคาครั้งใหญ่
🔹นักเทรดระบบ (Systematic): ผู้ที่ต้องการเงื่อนไขทางคณิตศาสตร์เพื่อกรองช่วงที่ตลาดไม่มีทิศทาง (Choppy) ออกไป
--------------------
⏺️ How to use
🔹 Low Volatility (Below Level)
Market is calm → price moves slowly → often indicates consolidation
→ Watch for potential breakout
🔹 High Volatility (Above Level)
Market is active → price swings strongly → trend or panic phase
→ Reduce position size / widen stop loss
🔹 Volatility Expansion
Volatility rising rapidly → potential start of strong move
🔹 Volatility Contraction
Volatility decreasing → market stabilizing → possible base formation
🔹 Vol below MA after spike
Indicates market cooling down after strong movement → Watch for next directional setup
⏺️ วิธีใช้งาน
🔹 Vol ต่ำ (ต่ำกว่าเส้น Level)
ตลาดนิ่ง → ราคาแกว่งแคบ → มักเป็นช่วงสะสม / sideway → รอ breakout
🔹 Vol สูง (สูงกว่าเส้น Level)
ตลาดแรง → ราคาเหวี่ยงแรง → trend หรือ panic → ลดขนาดไม้ / stop กว้างขึ้น
🔹 Vol พุ่งขึ้น (Expansion)
มีโอกาสเกิด move ใหญ่
🔹 Vol ลดลง (Contraction)
ตลาดเริ่มนิ่ง → อาจกำลังสร้างฐาน
🔹 Vol ต่ำกว่า MA หลังจากเคยสูงมาก
ตลาดเริ่มเย็นลง → เตรียมเข้าสู่ phase ใหม่
--------------------
⏺️ Key Features
🔹Annualized Projection: Converts daily price swings into a familiar yearly percentage format.
🔹Trend Following MA: Built-in Moving Average to filter out minor noise in volatility.
🔹Customizable Threshold: Easily adjust the horizontal "Warning Level" to fit different assets (e.g., Stocks vs. Crypto).
⏺️ จุดเด่น
🔹คำนวณแบบรายปี: แปลงการแกว่งรายวันให้เป็นรูปแบบเปอร์เซ็นต์ต่อปีที่เข้าใจง่าย
🔹มีเส้นค่าเฉลี่ยในตัว: ช่วยกรองสัญญาณหลอก (Noise) ของความผันผวน ทำให้เห็นแนวโน้มหลักชัดเจน
🔹ปรับเกณฑ์ได้อิสระ: สามารถปรับเส้น Horizontal Level ให้เหมาะกับสินทรัพย์แต่ละประเภท (เช่น หุ้นไทย vs คริปโต)
--------------------
Disclaimer
🔹This indicator is for educational and informational purposes only.
🔹Volatility does not predict direction, only magnitude. Always use in conjunction with price action.
🔹Indicator นี้ใช้เพื่อการศึกษาเท่านั้น
🔹ความผันผวนบอก "ขนาด" ของการเหวี่ยง แต่ไม่ได้บอก "ทิศทาง" ควรใช้ควบคู่กับการวิเคราะห์แนวโน้มราคาเสมอ

Disclaimer
The information and publications are not meant to be, and do not constitute, financial, investment, trading, or other types of advice or recommendations supplied or endorsed by TradingView. Read more in the Terms of Use.
Disclaimer
The information and publications are not meant to be, and do not constitute, financial, investment, trading, or other types of advice or recommendations supplied or endorsed by TradingView. Read more in the Terms of Use.