OPEN-SOURCE SCRIPT
Vishal Trades Box Strategy
Vishal Trades Box Strategy
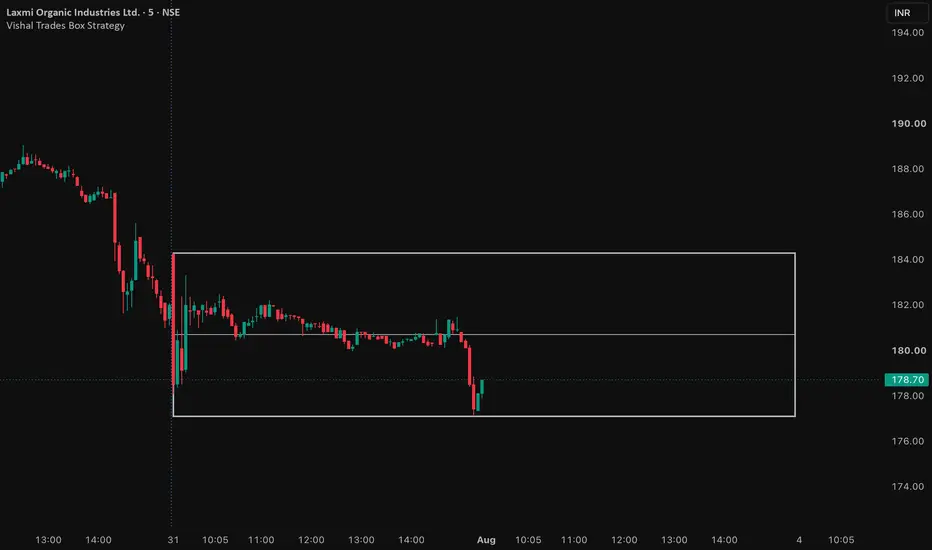
The Vishal Trades Box Strategy is a price action–based trading tool that automatically plots the previous trading session's High, Low, and Midpoint as a range box. The box is extended into the current trading session, allowing traders to identify key support, resistance, breakout, and rejection zones before the market opens.
By using the previous day's range, traders can quickly determine whether price is accepting or rejecting important levels, making it easier to plan high-probability entries, stop-loss placements, and profit targets. The strategy is designed to reduce chart clutter while keeping the most relevant market structure visible throughout the trading day.
Features:
Automatically plots the previous trading session's High and Low.
Draws the 50% midpoint of the previous day's range.
Extends the range into the current trading session.
Clean, lightweight, and non-repainting.
Works seamlessly on intraday timeframes.
Ideal for breakout, reversal, and range-bound trading strategies.
Suitable for stocks, indices, futures, and other liquid markets.
This indicator is built around the philosophy of keeping trading simple by focusing on important price levels rather than unnecessary indicators, helping traders make objective and disciplined trading decisions.
The Vishal Trades Box Strategy is a price action–based trading tool that automatically plots the previous trading session's High, Low, and Midpoint as a range box. The box is extended into the current trading session, allowing traders to identify key support, resistance, breakout, and rejection zones before the market opens.
By using the previous day's range, traders can quickly determine whether price is accepting or rejecting important levels, making it easier to plan high-probability entries, stop-loss placements, and profit targets. The strategy is designed to reduce chart clutter while keeping the most relevant market structure visible throughout the trading day.
Features:
Automatically plots the previous trading session's High and Low.
Draws the 50% midpoint of the previous day's range.
Extends the range into the current trading session.
Clean, lightweight, and non-repainting.
Works seamlessly on intraday timeframes.
Ideal for breakout, reversal, and range-bound trading strategies.
Suitable for stocks, indices, futures, and other liquid markets.
This indicator is built around the philosophy of keeping trading simple by focusing on important price levels rather than unnecessary indicators, helping traders make objective and disciplined trading decisions.
Open-source script
In true TradingView spirit, the creator of this script has made it open-source, so that traders can review and verify its functionality. Kudos to the author! While you can use it for free, remember that republishing the code is subject to our House Rules.

We Teach, You Trade.
youtube.com/@vishaltrades
youtube.com/@vishaltrades
Disclaimer
The information and publications are not meant to be, and do not constitute, financial, investment, trading, or other types of advice or recommendations supplied or endorsed by TradingView. Read more in the Terms of Use.
Open-source script
In true TradingView spirit, the creator of this script has made it open-source, so that traders can review and verify its functionality. Kudos to the author! While you can use it for free, remember that republishing the code is subject to our House Rules.
We Teach, You Trade.
youtube.com/@vishaltrades
youtube.com/@vishaltrades
Disclaimer
The information and publications are not meant to be, and do not constitute, financial, investment, trading, or other types of advice or recommendations supplied or endorsed by TradingView. Read more in the Terms of Use.