OPEN-SOURCE SCRIPT
Relative Volume (RVOL) Surge Dashboard
Overview
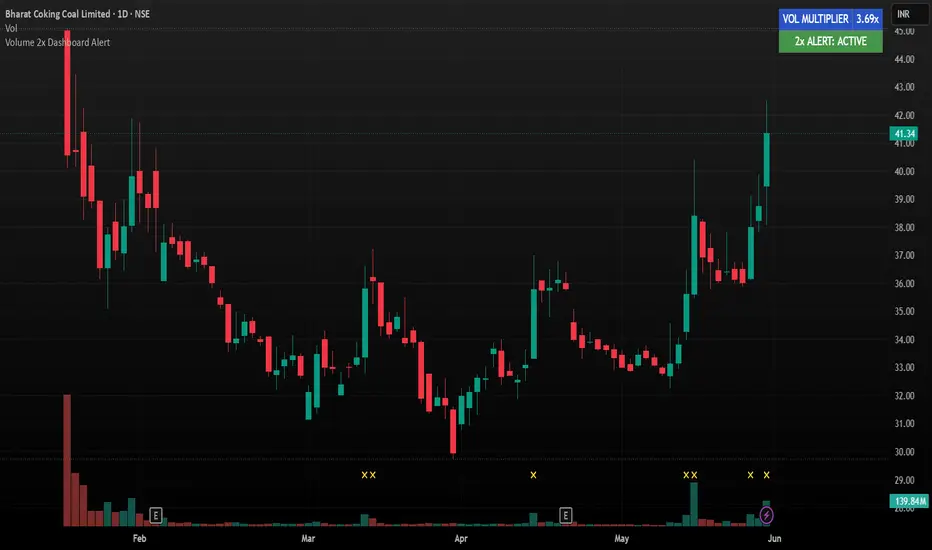
The **Relative Volume (RVOL) Surge Dashboard** is a utility script designed to visually isolate institutional activity and anomalies in volume. In financial markets, sudden volume spikes that double the recent average often signal institutional presence, news-driven breakouts, or potential trend exhaustion points.
This indicator keeps your main chart clean while feeding you live volume metrics via an on-chart HUD (Heads-Up Display).
Key Features
* **Live Relative Volume Multiplier: ** Instantly displays exactly how many times the current bar's volume is exceeding its standard historical moving average (e.g., 1.54x, 3.10x).
* **Smart UI Dashboard: ** A customizable, clean panel that switches colors (Green/Red) immediately depending on whether a 2x volume surge is active or normal.
* **On-Chart Signals: ** Draws a clean yellow cross at the bottom of the price bar whenever a volume anomaly occurs.
* **Built-in Alert Engine: ** Supports native Trading View alert conditions so you can receive push notifications, email, or webhook alerts the exact second a volume anomaly prints.
How to Use It
1. **Trend Breakout Confirmation: ** Look for the dashboard to trigger a green "2x ALERT: ACTIVE" during a consolidation breakout. High volume confirms validity.
2. **Climactic Reversals: ** If a stock has been in an extended downtrend/uptrend and suddenly prints a massive 2x+ volume spike without making significant price progress, look for a potential reversal.
3. **Customization: ** Use the settings panel to change the lookback period (default is 20 bars) or move the dashboard to any corner of your screen to prevent overlapping other indicators.
DISCLAIMER:
This script is created for educational, informational, and utility purposes only. It does not constitute financial, investment, or trading advice. Past performance of any volume metrics or technical signals is not indicative of future results. Financial markets involve substantial risk of loss, and individual traders are entirely responsible for their own capital allocation and risk management. Always perform your own due diligence before entering any trade.
The **Relative Volume (RVOL) Surge Dashboard** is a utility script designed to visually isolate institutional activity and anomalies in volume. In financial markets, sudden volume spikes that double the recent average often signal institutional presence, news-driven breakouts, or potential trend exhaustion points.
This indicator keeps your main chart clean while feeding you live volume metrics via an on-chart HUD (Heads-Up Display).
Key Features
* **Live Relative Volume Multiplier: ** Instantly displays exactly how many times the current bar's volume is exceeding its standard historical moving average (e.g., 1.54x, 3.10x).
* **Smart UI Dashboard: ** A customizable, clean panel that switches colors (Green/Red) immediately depending on whether a 2x volume surge is active or normal.
* **On-Chart Signals: ** Draws a clean yellow cross at the bottom of the price bar whenever a volume anomaly occurs.
* **Built-in Alert Engine: ** Supports native Trading View alert conditions so you can receive push notifications, email, or webhook alerts the exact second a volume anomaly prints.
How to Use It
1. **Trend Breakout Confirmation: ** Look for the dashboard to trigger a green "2x ALERT: ACTIVE" during a consolidation breakout. High volume confirms validity.
2. **Climactic Reversals: ** If a stock has been in an extended downtrend/uptrend and suddenly prints a massive 2x+ volume spike without making significant price progress, look for a potential reversal.
3. **Customization: ** Use the settings panel to change the lookback period (default is 20 bars) or move the dashboard to any corner of your screen to prevent overlapping other indicators.
DISCLAIMER:
This script is created for educational, informational, and utility purposes only. It does not constitute financial, investment, or trading advice. Past performance of any volume metrics or technical signals is not indicative of future results. Financial markets involve substantial risk of loss, and individual traders are entirely responsible for their own capital allocation and risk management. Always perform your own due diligence before entering any trade.
Open-source script
In true TradingView spirit, the creator of this script has made it open-source, so that traders can review and verify its functionality. Kudos to the author! While you can use it for free, remember that republishing the code is subject to our House Rules.

Disclaimer
The information and publications are not meant to be, and do not constitute, financial, investment, trading, or other types of advice or recommendations supplied or endorsed by TradingView. Read more in the Terms of Use.
Open-source script
In true TradingView spirit, the creator of this script has made it open-source, so that traders can review and verify its functionality. Kudos to the author! While you can use it for free, remember that republishing the code is subject to our House Rules.
Disclaimer
The information and publications are not meant to be, and do not constitute, financial, investment, trading, or other types of advice or recommendations supplied or endorsed by TradingView. Read more in the Terms of Use.