OPEN-SOURCE SCRIPT
Fibonacci Projection with Volume & Delta Profile
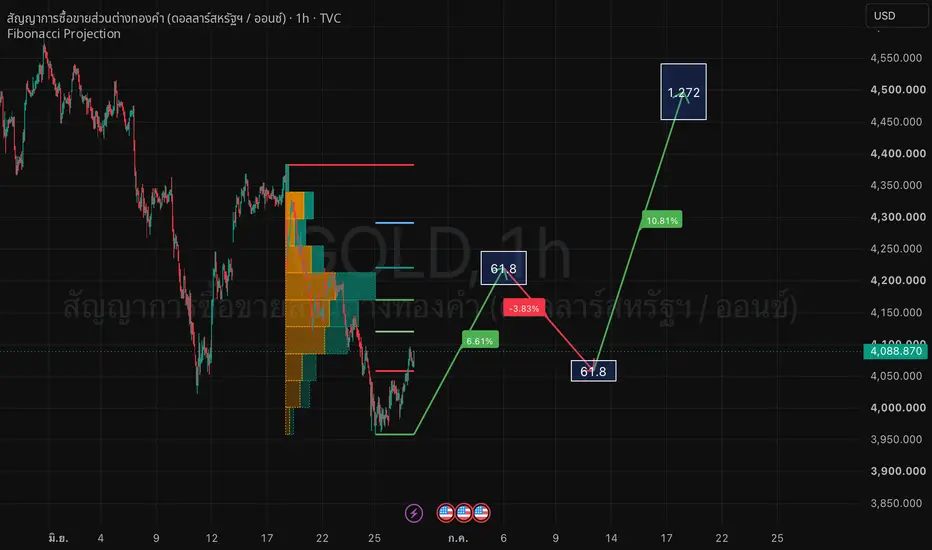
Fibonacci Projection with Volume & Delta Profile
Fibonacci Projection with Volume & Delta Profile is a technical analysis tool designed to help traders project potential price targets, retracement zones, and reaction areas by combining Fibonacci projection levels with volume and delta profile data.
Fibonacci Projection with Volume & Delta Profile เป็นเครื่องมือวิเคราะห์ทางเทคนิคที่ออกแบบมาเพื่อช่วยให้นักเทรดคาดการณ์เป้าหมายราคา โซนย่อพัก และพื้นที่ที่ราคาอาจเกิดการตอบสนอง โดยใช้ระดับ Fibonacci Projection ร่วมกับข้อมูล Volume และ Delta Profile
Main Features / คุณสมบัติหลัก
1. Fibonacci Projection
The indicator displays Fibonacci projection levels to help identify possible future price targets and potential reaction zones.
อินดิเคเตอร์จะแสดงระดับ Fibonacci Projection เพื่อช่วยระบุเป้าหมายราคาที่เป็นไปได้ในอนาคต และโซนที่ราคาอาจเกิดการตอบสนอง
2. Retracement and Expansion Zones
Key Fibonacci areas such as 61.8%, 100%, 127.2%, and other important projection levels can be used as reference zones for trend continuation, pullback, or reversal analysis.
โซน Fibonacci สำคัญ เช่น 61.8%, 100%, 127.2% และระดับ Projection อื่น ๆ สามารถใช้เป็นโซนอ้างอิงสำหรับวิเคราะห์การไปต่อของเทรนด์ การย่อพัก หรือการกลับตัวของราคา
3. Volume Profile
Volume Profile helps traders see where high-volume and low-volume trading activity occurred within the selected price range.
Volume Profile ช่วยให้นักเทรดเห็นพื้นที่ที่มีปริมาณการซื้อขายสูงและต่ำภายในช่วงราคาที่เลือก
4. Delta Profile
Delta Profile helps visualize buying and selling pressure by comparing aggressive buyer activity and aggressive seller activity.
Delta Profile ช่วยแสดงแรงซื้อและแรงขาย โดยเปรียบเทียบพฤติกรรมของผู้ซื้อเชิงรุกและผู้ขายเชิงรุก
5. Price Projection Path
The projection path can help traders visualize possible market movement scenarios based on Fibonacci structure and price behavior.
เส้น Projection Path ช่วยให้นักเทรดมองเห็นสถานการณ์การเคลื่อนไหวของราคาที่เป็นไปได้ โดยอิงจากโครงสร้าง Fibonacci และพฤติกรรมราคา
How to Use / วิธีใช้งาน
- Use Fibonacci Projection levels to identify possible upside or downside targets.
- ใช้ระดับ Fibonacci Projection เพื่อดูเป้าหมายราคาฝั่งขึ้นหรือฝั่งลงที่เป็นไปได้
- Use 61.8%, 100%, and 127.2% zones as important reaction areas.
- ใช้โซน 61.8%, 100% และ 127.2% เป็นพื้นที่สำคัญที่ราคาอาจเกิดการตอบสนอง
- Use Volume Profile to identify high-interest price areas.
- ใช้ Volume Profile เพื่อดูโซนราคาที่มีความสนใจในการซื้อขายสูง
- Use Delta Profile to analyze buyer and seller pressure.
- ใช้ Delta Profile เพื่อวิเคราะห์แรงซื้อและแรงขาย
- Combine this tool with market structure, trend direction, support/resistance, and proper risk management.
- ควรใช้งานร่วมกับโครงสร้างตลาด ทิศทางแนวโน้ม แนวรับ/แนวต้าน และการบริหารความเสี่ยงที่เหมาะสม
Recommended Markets / ตลาดที่เหมาะสม
This indicator can be used on forex, gold, indices, crypto, stocks, and other liquid markets. It is suitable for intraday analysis, swing trading, and multi-timeframe market structure analysis.
อินดิเคเตอร์นี้สามารถใช้ได้กับ Forex, Gold, Indices, Crypto, Stocks และตลาดที่มีสภาพคล่อง เหมาะสำหรับการวิเคราะห์ Intraday, Swing Trading และการอ่านโครงสร้างราคาหลาย Timeframe
Important Note / หมายเหตุสำคัญ
This indicator does not provide guaranteed buy or sell signals. It is designed as a visual analysis and decision-support tool only.
อินดิเคเตอร์นี้ไม่ได้ให้สัญญาณซื้อขายที่รับประกันผลลัพธ์ แต่ถูกออกแบบมาเพื่อเป็นเครื่องมือช่วยวิเคราะห์และช่วยประกอบการตัดสินใจเท่านั้น
Disclaimer / ข้อจำกัดความรับผิดชอบ
This script is not financial advice, investment advice, or a solicitation to buy or sell any financial instrument. Trading involves risk, and users are responsible for their own trading decisions.
สคริปต์นี้ไม่ใช่คำแนะนำทางการเงิน ไม่ใช่คำแนะนำการลงทุน และไม่ใช่การชักชวนให้ซื้อหรือขายสินทรัพย์ใด ๆ การเทรดมีความเสี่ยง ผู้ใช้งานต้องรับผิดชอบต่อการตัดสินใจของตนเอง
Fibonacci Projection with Volume & Delta Profile is a technical analysis tool designed to help traders project potential price targets, retracement zones, and reaction areas by combining Fibonacci projection levels with volume and delta profile data.
Fibonacci Projection with Volume & Delta Profile เป็นเครื่องมือวิเคราะห์ทางเทคนิคที่ออกแบบมาเพื่อช่วยให้นักเทรดคาดการณ์เป้าหมายราคา โซนย่อพัก และพื้นที่ที่ราคาอาจเกิดการตอบสนอง โดยใช้ระดับ Fibonacci Projection ร่วมกับข้อมูล Volume และ Delta Profile
Main Features / คุณสมบัติหลัก
1. Fibonacci Projection
The indicator displays Fibonacci projection levels to help identify possible future price targets and potential reaction zones.
อินดิเคเตอร์จะแสดงระดับ Fibonacci Projection เพื่อช่วยระบุเป้าหมายราคาที่เป็นไปได้ในอนาคต และโซนที่ราคาอาจเกิดการตอบสนอง
2. Retracement and Expansion Zones
Key Fibonacci areas such as 61.8%, 100%, 127.2%, and other important projection levels can be used as reference zones for trend continuation, pullback, or reversal analysis.
โซน Fibonacci สำคัญ เช่น 61.8%, 100%, 127.2% และระดับ Projection อื่น ๆ สามารถใช้เป็นโซนอ้างอิงสำหรับวิเคราะห์การไปต่อของเทรนด์ การย่อพัก หรือการกลับตัวของราคา
3. Volume Profile
Volume Profile helps traders see where high-volume and low-volume trading activity occurred within the selected price range.
Volume Profile ช่วยให้นักเทรดเห็นพื้นที่ที่มีปริมาณการซื้อขายสูงและต่ำภายในช่วงราคาที่เลือก
4. Delta Profile
Delta Profile helps visualize buying and selling pressure by comparing aggressive buyer activity and aggressive seller activity.
Delta Profile ช่วยแสดงแรงซื้อและแรงขาย โดยเปรียบเทียบพฤติกรรมของผู้ซื้อเชิงรุกและผู้ขายเชิงรุก
5. Price Projection Path
The projection path can help traders visualize possible market movement scenarios based on Fibonacci structure and price behavior.
เส้น Projection Path ช่วยให้นักเทรดมองเห็นสถานการณ์การเคลื่อนไหวของราคาที่เป็นไปได้ โดยอิงจากโครงสร้าง Fibonacci และพฤติกรรมราคา
How to Use / วิธีใช้งาน
- Use Fibonacci Projection levels to identify possible upside or downside targets.
- ใช้ระดับ Fibonacci Projection เพื่อดูเป้าหมายราคาฝั่งขึ้นหรือฝั่งลงที่เป็นไปได้
- Use 61.8%, 100%, and 127.2% zones as important reaction areas.
- ใช้โซน 61.8%, 100% และ 127.2% เป็นพื้นที่สำคัญที่ราคาอาจเกิดการตอบสนอง
- Use Volume Profile to identify high-interest price areas.
- ใช้ Volume Profile เพื่อดูโซนราคาที่มีความสนใจในการซื้อขายสูง
- Use Delta Profile to analyze buyer and seller pressure.
- ใช้ Delta Profile เพื่อวิเคราะห์แรงซื้อและแรงขาย
- Combine this tool with market structure, trend direction, support/resistance, and proper risk management.
- ควรใช้งานร่วมกับโครงสร้างตลาด ทิศทางแนวโน้ม แนวรับ/แนวต้าน และการบริหารความเสี่ยงที่เหมาะสม
Recommended Markets / ตลาดที่เหมาะสม
This indicator can be used on forex, gold, indices, crypto, stocks, and other liquid markets. It is suitable for intraday analysis, swing trading, and multi-timeframe market structure analysis.
อินดิเคเตอร์นี้สามารถใช้ได้กับ Forex, Gold, Indices, Crypto, Stocks และตลาดที่มีสภาพคล่อง เหมาะสำหรับการวิเคราะห์ Intraday, Swing Trading และการอ่านโครงสร้างราคาหลาย Timeframe
Important Note / หมายเหตุสำคัญ
This indicator does not provide guaranteed buy or sell signals. It is designed as a visual analysis and decision-support tool only.
อินดิเคเตอร์นี้ไม่ได้ให้สัญญาณซื้อขายที่รับประกันผลลัพธ์ แต่ถูกออกแบบมาเพื่อเป็นเครื่องมือช่วยวิเคราะห์และช่วยประกอบการตัดสินใจเท่านั้น
Disclaimer / ข้อจำกัดความรับผิดชอบ
This script is not financial advice, investment advice, or a solicitation to buy or sell any financial instrument. Trading involves risk, and users are responsible for their own trading decisions.
สคริปต์นี้ไม่ใช่คำแนะนำทางการเงิน ไม่ใช่คำแนะนำการลงทุน และไม่ใช่การชักชวนให้ซื้อหรือขายสินทรัพย์ใด ๆ การเทรดมีความเสี่ยง ผู้ใช้งานต้องรับผิดชอบต่อการตัดสินใจของตนเอง
Open-source script
In true TradingView spirit, the creator of this script has made it open-source, so that traders can review and verify its functionality. Kudos to the author! While you can use it for free, remember that republishing the code is subject to our House Rules.

Disclaimer
The information and publications are not meant to be, and do not constitute, financial, investment, trading, or other types of advice or recommendations supplied or endorsed by TradingView. Read more in the Terms of Use.
Open-source script
In true TradingView spirit, the creator of this script has made it open-source, so that traders can review and verify its functionality. Kudos to the author! While you can use it for free, remember that republishing the code is subject to our House Rules.
Disclaimer
The information and publications are not meant to be, and do not constitute, financial, investment, trading, or other types of advice or recommendations supplied or endorsed by TradingView. Read more in the Terms of Use.