Updated
OB Watchlist Distance
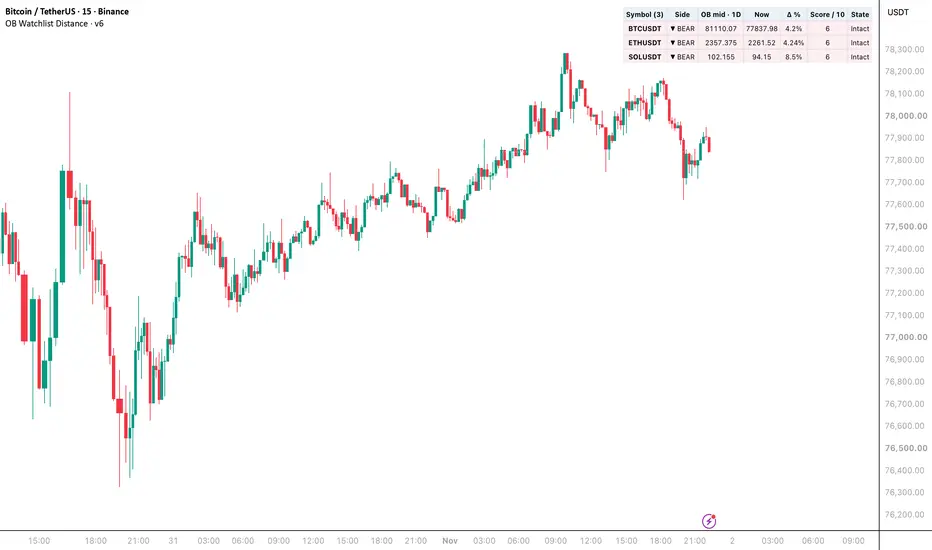
OB Watchlist Distance evaluates up to ten user-selected symbols and shows, in a single panel on the chart, how far each one is from its nearest active Order Block and the quality score of that Order Block.
For each symbol the script detects bullish and bearish Order Blocks on Break of Structure on the timeframe you select. The most recent unmitigated Order Block on each side is found, and whichever is closer to the current price is reported.
The panel shows, for every symbol: side (BULL or BEAR), OB price, current price, distance to the OB in percent, score from 1 to 10, and state (Active or No OB). Rows where the distance is within the proximity threshold and the score meets the high-quality threshold are highlighted in yellow. The header shows the count of active symbols.
Settings include ten symbol picker slots (leave any empty to skip it), OB detection parameters (pivot length, BOS body filter, OB lookback bars, ATR length), and visual options for the panel position and the proximity and score thresholds.
Limitations. The script uses one request.security() call per symbol, so it is capped at ten symbols by Pine's call budget. Only the current chart's symbol can be drawn with boxes on the price chart; the other symbols are summarized in the panel only. The score used here is a lightweight displacement-only formula to keep the inline per-symbol evaluation fast. For the full five-feature score (Displacement, Volume, FVG, Freshness, Trend) and on-chart Order Block drawings, use the companion Order Blocks Score [1-10] indicator.
Recommended timeframe: 1D or 4H for swing context, 1H for intraday scanning.
For each symbol the script detects bullish and bearish Order Blocks on Break of Structure on the timeframe you select. The most recent unmitigated Order Block on each side is found, and whichever is closer to the current price is reported.
The panel shows, for every symbol: side (BULL or BEAR), OB price, current price, distance to the OB in percent, score from 1 to 10, and state (Active or No OB). Rows where the distance is within the proximity threshold and the score meets the high-quality threshold are highlighted in yellow. The header shows the count of active symbols.
Settings include ten symbol picker slots (leave any empty to skip it), OB detection parameters (pivot length, BOS body filter, OB lookback bars, ATR length), and visual options for the panel position and the proximity and score thresholds.
Limitations. The script uses one request.security() call per symbol, so it is capped at ten symbols by Pine's call budget. Only the current chart's symbol can be drawn with boxes on the price chart; the other symbols are summarized in the panel only. The score used here is a lightweight displacement-only formula to keep the inline per-symbol evaluation fast. For the full five-feature score (Displacement, Volume, FVG, Freshness, Trend) and on-chart Order Block drawings, use the companion Order Blocks Score [1-10] indicator.
Recommended timeframe: 1D or 4H for swing context, 1H for intraday scanning.
Release Notes
OB WATCHLIST DISTANCE — SCAN ORIGIN REFERENCES ACROSS MARKETSOB Watchlist Distance displays one selected order-block reference per market, its midpoint price, distance from the source close and a discrete displacement score. Up to ten symbols share one detection timeframe, creating a compact workspace for deciding which source charts deserve closer inspection.
The indicator uses a price-based order-block definition. It does not observe institutional transactions, resting orders or execution quality, and its score is not a win probability.
01 / CONFIGURE THE WATCHLIST
The first three symbols initially use BINANCE:BTCUSDT, BINANCE:ETHUSDT and BINANCE:SOLUSDT. Seven further slots are blank and omitted from the visible panel. Use the intended exchange/feed; the row name omits the exchange prefix for compactness.
OB timeframe, initially 1D, applies to all rows. Detection, ATR, source close and boundary checks use that interval. The chart symbol and chart interval do not replace an explicitly selected OB timeframe. The refreshed midpoint header includes this setting so its context is visible in the panel.
02 / HOW A BLOCK IS CREATED
The source scan tracks the latest confirmed pivot high and low. Swing length defaults to five bars on each side, so an originating pivot becomes known only after five later source bars.
A bullish candidate requires a close strictly above the stored high while the previous close was at or below that same level, plus a positive candle body strictly larger than BOS body / ATR times ATR. The bearish case uses the stored low, a previous close at or above it and a sufficiently large negative body. The initial body threshold is 0.5 times ATR 14.
After a qualifying bullish cross, the scan searches backward for the most recent bearish candle. After a bearish cross, it searches for the most recent bullish candle. The selected candle's full high–low range becomes the block. Doji candles do not qualify as those opposite candles.
OB lookback bars, initially ten, limits this origin search. It is not an expiry age for an existing block. If no opposite candle is found, no replacement is created. The latest qualifying block replaces the previous record on the same side; the engine retains at most one bullish and one bearish record per market.
03 / WHAT INTACT AND NO OB MEAN
A bullish block is excluded after a source close strictly below its low. A bearish block is excluded after a source close strictly above its high. An exact close on the boundary does not qualify as a break. A wick through a boundary or a touch inside the block does not invalidate it by itself.
The new Intact label replaces the old Active wording. It means the chosen block has not met that boundary-close condition. It does not mean the zone is untouched, fresh or a confirmed support/resistance reaction. No OB means neither side currently qualifies for selection, including when the necessary origin has not yet formed.
If both sides remain eligible, selection compares absolute distance from the source close to the bullish block's low and the bearish block's high. A tie favors the bullish side. This is an edge-based selection rule; it does not necessarily select the nearest midpoint or the nearest zone boundary in every price configuration.
04 / MIDPOINT, DISTANCE AND SCORE
OB mid is the average of the selected block's high and low. Now is that market's close from the requested OB interval. Δ % is the absolute midpoint distance divided by Now, multiplied by 100. It has no directional sign and is not distance to the near edge.
The score is fixed when a new block forms. The displacement measure divides by the greater of ATR and the symbol's minimum tick. For bullish blocks it uses break-candle close minus block high; for bearish blocks it uses block high minus break-candle close. That legacy asymmetry is preserved.
Scores are assigned in four steps:
- Above 3 ATR: 10.
- Above 2 ATR, up to 3: 8.
- Above 1 ATR, up to 2: 6.
- Otherwise: 4.
The score is a descriptive displacement bucket, not a continuously recalculated quality rating. It does not include subsequent reaction, volume, untouched status or profitability.
05 / HOW TO READ THE HIGHLIGHT
The initial proximity threshold is Δ % at or below 1%. The initial score threshold is at least 7; with the four available score values, that admits 8 and 10.
A soft amber row requires both proximity and the minimum score. The distance value is bold/amber when proximity alone qualifies; the score value is bold/amber when its own threshold qualifies. Those individual accents can appear without the whole row turning amber.
Teal and rose row tints distinguish selected bullish and bearish references. The updated panel follows the chart theme, initially sits at Top Right and defaults to Small text. Six positions and Tiny/Small/Normal sizes are available. Maximum price decimals offers two, four, six or eight, initially four; it changes displayed prices without changing block selection or distance calculations.
06 / TIMING AND A REVIEW WORKFLOW
The existing requests sample current source outputs with gaps_off and lookahead_off. The engine has no separate source-bar confirmation switch. A developing candle can change its close, body filter, break qualification and boundary status before it finishes. Chart-bar closure does not necessarily coincide with closure of a higher-interval source candle, and historical/realtime availability can differ.
Lower-than-chart requests are sampled rather than a record of every intrabar. Feed access, loaded history, market hours and chart executions also affect the display. There are no dedicated alertcondition definitions, orders, stops, targets or performance statistics.
Use the table to shortlist context, then open the source chart to inspect the chosen candle and boundaries. Check whether edge-based selection and midpoint distance fit your intended review. Any entry, allocation or exit rule requires a separate process.
This update preserves detection, retained block state, all ten requests, side selection, score formulas and proximity thresholds. Changes refresh the theme, accents, text sizing, price precision, initial position and midpoint/timeframe/state wording.

Disclaimer
The information and publications are not meant to be, and do not constitute, financial, investment, trading, or other types of advice or recommendations supplied or endorsed by TradingView. Read more in the Terms of Use.
Disclaimer
The information and publications are not meant to be, and do not constitute, financial, investment, trading, or other types of advice or recommendations supplied or endorsed by TradingView. Read more in the Terms of Use.