Liquidity Trap Radar PRO [Thomas]
Introduction
Liquidity Trap Radar PRO [Thomas] is a Pine Script v6 indicator developed to help traders analyze liquidity sweeps, false breakouts, potential market reversals, and changes in market structure. The main concept behind this indicator is to identify situations where price moves beyond a previous high or low but fails to maintain that breakout and closes back inside the previous trading range. These price movements can provide useful information about potential liquidity-trap situations and help traders study how the market reacts around important price levels.
The indicator is designed with a focus on clean chart presentation, selective signals, and adjustable analysis settings. Instead of displaying unnecessary signals across the chart, it looks for specific price-action conditions before identifying a potential bullish or bearish liquidity trap. It can be used on different instruments and timeframes, including Gold (XAUUSD) and Bitcoin (BTCUSD), depending on the trader's preferred strategy and settings.
Liquidity Sweep and Trap Detection

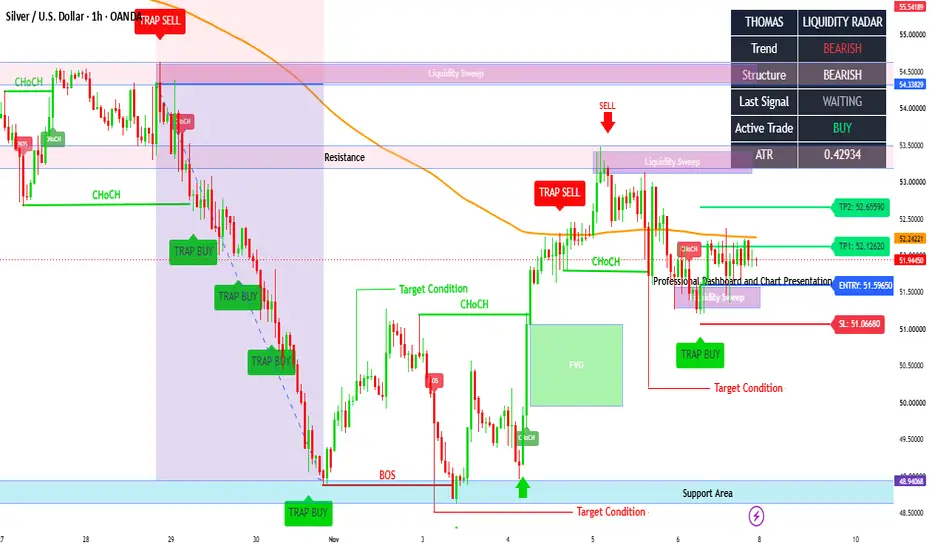
The core feature of Thomas | Liquidity Trap Radar PRO is its liquidity-sweep detection system. It monitors previous highs and lows using a configurable lookback period. When price moves above a previous high but closes back below that level, the indicator identifies a potential bearish liquidity sweep. Similarly, when price moves below a previous low but closes back above it, the indicator identifies a potential bullish liquidity sweep.
These conditions are used to identify potential failed breakouts. A bullish trap signal requires a downside sweep followed by a bullish candle close, while a bearish trap signal requires an upside sweep followed by a bearish candle close. The indicator also includes a signal cooldown setting to help control repeated signals within a short period. These signals represent technical conditions and should always be evaluated in the context of the overall market.
Market Structure Analysis – BOS and CHoCH

Market structure is another important part of this indicator. Thomas | Liquidity Trap Radar PRO uses swing pivot highs and lows to monitor potential structural changes in price. When price breaks above a previously confirmed swing high, the indicator can identify a bullish BOS or CHoCH depending on the previously detected market structure. When price breaks below a confirmed swing low, it can identify a bearish BOS or CHoCH.
This feature helps traders observe potential changes in market direction and understand how price is developing around important structural levels. Pivot confirmation requires a number of bars, so BOS and CHoCH labels may appear after the actual turning point rather than immediately.
Trend and Volume Confirmation
To provide additional flexibility, the indicator includes an optional EMA trend filter. Traders can enable the EMA filter to require price to be above the selected EMA for bullish signals or below it for bearish signals. The default EMA length is 200, but it can be adjusted according to individual preferences and market conditions.
An optional relative-volume filter is also available. When enabled, the indicator compares the current volume with its average volume to determine whether the selected volume condition is satisfied. Both filters can be enabled or disabled independently, allowing traders to customize the indicator according to their analysis style. Volume data may vary between instruments and brokers, particularly in Forex markets.
Dynamic Entry, Stop Loss and Take Profit Levels

Thomas | Liquidity Trap Radar PRO includes an ATR-based risk-level calculation system. When a qualifying BUY or SELL condition appears, the indicator calculates a reference entry level using the signal candle's closing price. The Stop Loss is calculated using the signal candle's high or low with an additional ATR-based buffer to account for market volatility.
Based on the calculated risk distance, the indicator displays two potential profit targets: TP1 and TP2. Both targets are calculated using adjustable risk-to-reward settings. Traders can modify the ATR length, Stop Loss buffer, TP1 ratio, and TP2 ratio according to their preferred risk-management approach. These levels are analytical reference points and do not represent actual executed trades or guaranteed outcomes.
Professional Dashboard and Chart Presentation

The indicator also includes a compact information dashboard designed to present important market information in one place. It displays the current EMA-based trend direction, detected market-structure direction, latest signal status, active trade direction, and ATR value. This allows traders to review several technical conditions without needing to add multiple separate indicators to their charts.
For chart customization, traders can independently enable or disable the BUY and SELL signals, trend EMA, BOS and CHoCH labels, trade levels, and dashboard. The right-side Entry, SL, TP1, and TP2 labels make the calculated reference levels easier to identify while keeping the chart organized.
Alert System
The indicator provides separate alert conditions for potential Liquidity Trap BUY signals, Liquidity Trap SELL signals, bullish market-structure breaks, and bearish market-structure breaks. Traders can create alerts through TradingView and monitor the selected technical conditions without continuously watching the chart. Alerts should be configured according to the trader's preferred instrument and timeframe.
Recommended Markets and Usage
Liquidity Trap Radar PRO [Thomas] can be applied to markets such as Gold (XAUUSD) and Bitcoin (BTCUSD). Its settings can be adjusted for different timeframes, market volatility, and trading approaches. Traders may find it useful to combine liquidity-sweep observations with higher-timeframe market direction, support and resistance, and other relevant technical-analysis tools before making a trading decision.
There is no single setting that works equally well in every market condition. For this reason, traders should experiment with the lookback period, EMA filter, volume confirmation, pivot length, and ATR risk settings using historical charts and demo trading before applying them in live market conditions.
Important Information and Limitations
This indicator is a technical-analysis tool designed to identify programmed price-action conditions. A liquidity sweep does not necessarily mean that a reversal will follow, and a potential BUY or SELL signal should not be considered a guaranteed trading opportunity. The indicator does not have access to actual institutional orders, centralized order-flow information, or the intentions of market participants. Its signals are based on chart prices, selected filters, and available volume data.
Market structure labels depend on confirmed pivot points and therefore may appear with a delay. EMA and volume filters can help customize signal conditions, but they cannot eliminate false signals or market risk. Entry, Stop Loss, and Take Profit levels are calculated reference levels and should not replace independent risk management.
Final Thoughts
Liquidity Trap Radar PRO [Thomas] was developed to bring liquidity-sweep analysis, potential false-breakout signals, market-structure observations, and ATR-based risk levels together in one organized TradingView indicator. Its purpose is to support technical analysis and help traders examine price behavior around previous highs, lows, and important market-structure levels.
Use the available settings according to your own trading approach, test the indicator carefully, and always make independent trading decisions. No indicator can guarantee accurate signals or consistent profits.
IMPORTANT NOTE – PLEASE READ

Some elements visible in this chart, including Liquidity Sweep, CHoCH, BOS, FVG, Support Area, Resistance, Target Conditions, green and red arrows, and highlighted zones, have been manually drawn and annotated by me for educational and analytical purposes.
These manually added drawings and annotations are NOT features of the indicator. They are not automatically generated by the indicator and should not be considered part of its built-in functionality.
Liquidity Trap Radar PRO [Thomas] is a Pine Script v6 indicator developed to help traders analyze liquidity sweeps, false breakouts, potential market reversals, and changes in market structure. The main concept behind this indicator is to identify situations where price moves beyond a previous high or low but fails to maintain that breakout and closes back inside the previous trading range. These price movements can provide useful information about potential liquidity-trap situations and help traders study how the market reacts around important price levels.
The indicator is designed with a focus on clean chart presentation, selective signals, and adjustable analysis settings. Instead of displaying unnecessary signals across the chart, it looks for specific price-action conditions before identifying a potential bullish or bearish liquidity trap. It can be used on different instruments and timeframes, including Gold (XAUUSD) and Bitcoin (BTCUSD), depending on the trader's preferred strategy and settings.
Liquidity Sweep and Trap Detection
The core feature of Thomas | Liquidity Trap Radar PRO is its liquidity-sweep detection system. It monitors previous highs and lows using a configurable lookback period. When price moves above a previous high but closes back below that level, the indicator identifies a potential bearish liquidity sweep. Similarly, when price moves below a previous low but closes back above it, the indicator identifies a potential bullish liquidity sweep.
These conditions are used to identify potential failed breakouts. A bullish trap signal requires a downside sweep followed by a bullish candle close, while a bearish trap signal requires an upside sweep followed by a bearish candle close. The indicator also includes a signal cooldown setting to help control repeated signals within a short period. These signals represent technical conditions and should always be evaluated in the context of the overall market.
Market Structure Analysis – BOS and CHoCH
Market structure is another important part of this indicator. Thomas | Liquidity Trap Radar PRO uses swing pivot highs and lows to monitor potential structural changes in price. When price breaks above a previously confirmed swing high, the indicator can identify a bullish BOS or CHoCH depending on the previously detected market structure. When price breaks below a confirmed swing low, it can identify a bearish BOS or CHoCH.
This feature helps traders observe potential changes in market direction and understand how price is developing around important structural levels. Pivot confirmation requires a number of bars, so BOS and CHoCH labels may appear after the actual turning point rather than immediately.
Trend and Volume Confirmation
To provide additional flexibility, the indicator includes an optional EMA trend filter. Traders can enable the EMA filter to require price to be above the selected EMA for bullish signals or below it for bearish signals. The default EMA length is 200, but it can be adjusted according to individual preferences and market conditions.
An optional relative-volume filter is also available. When enabled, the indicator compares the current volume with its average volume to determine whether the selected volume condition is satisfied. Both filters can be enabled or disabled independently, allowing traders to customize the indicator according to their analysis style. Volume data may vary between instruments and brokers, particularly in Forex markets.
Dynamic Entry, Stop Loss and Take Profit Levels
Thomas | Liquidity Trap Radar PRO includes an ATR-based risk-level calculation system. When a qualifying BUY or SELL condition appears, the indicator calculates a reference entry level using the signal candle's closing price. The Stop Loss is calculated using the signal candle's high or low with an additional ATR-based buffer to account for market volatility.
Based on the calculated risk distance, the indicator displays two potential profit targets: TP1 and TP2. Both targets are calculated using adjustable risk-to-reward settings. Traders can modify the ATR length, Stop Loss buffer, TP1 ratio, and TP2 ratio according to their preferred risk-management approach. These levels are analytical reference points and do not represent actual executed trades or guaranteed outcomes.
Professional Dashboard and Chart Presentation
The indicator also includes a compact information dashboard designed to present important market information in one place. It displays the current EMA-based trend direction, detected market-structure direction, latest signal status, active trade direction, and ATR value. This allows traders to review several technical conditions without needing to add multiple separate indicators to their charts.
For chart customization, traders can independently enable or disable the BUY and SELL signals, trend EMA, BOS and CHoCH labels, trade levels, and dashboard. The right-side Entry, SL, TP1, and TP2 labels make the calculated reference levels easier to identify while keeping the chart organized.
Alert System
The indicator provides separate alert conditions for potential Liquidity Trap BUY signals, Liquidity Trap SELL signals, bullish market-structure breaks, and bearish market-structure breaks. Traders can create alerts through TradingView and monitor the selected technical conditions without continuously watching the chart. Alerts should be configured according to the trader's preferred instrument and timeframe.
Recommended Markets and Usage
Liquidity Trap Radar PRO [Thomas] can be applied to markets such as Gold (XAUUSD) and Bitcoin (BTCUSD). Its settings can be adjusted for different timeframes, market volatility, and trading approaches. Traders may find it useful to combine liquidity-sweep observations with higher-timeframe market direction, support and resistance, and other relevant technical-analysis tools before making a trading decision.
There is no single setting that works equally well in every market condition. For this reason, traders should experiment with the lookback period, EMA filter, volume confirmation, pivot length, and ATR risk settings using historical charts and demo trading before applying them in live market conditions.
Important Information and Limitations
This indicator is a technical-analysis tool designed to identify programmed price-action conditions. A liquidity sweep does not necessarily mean that a reversal will follow, and a potential BUY or SELL signal should not be considered a guaranteed trading opportunity. The indicator does not have access to actual institutional orders, centralized order-flow information, or the intentions of market participants. Its signals are based on chart prices, selected filters, and available volume data.
Market structure labels depend on confirmed pivot points and therefore may appear with a delay. EMA and volume filters can help customize signal conditions, but they cannot eliminate false signals or market risk. Entry, Stop Loss, and Take Profit levels are calculated reference levels and should not replace independent risk management.
Final Thoughts
Liquidity Trap Radar PRO [Thomas] was developed to bring liquidity-sweep analysis, potential false-breakout signals, market-structure observations, and ATR-based risk levels together in one organized TradingView indicator. Its purpose is to support technical analysis and help traders examine price behavior around previous highs, lows, and important market-structure levels.
Use the available settings according to your own trading approach, test the indicator carefully, and always make independent trading decisions. No indicator can guarantee accurate signals or consistent profits.
IMPORTANT NOTE – PLEASE READ
Some elements visible in this chart, including Liquidity Sweep, CHoCH, BOS, FVG, Support Area, Resistance, Target Conditions, green and red arrows, and highlighted zones, have been manually drawn and annotated by me for educational and analytical purposes.
These manually added drawings and annotations are NOT features of the indicator. They are not automatically generated by the indicator and should not be considered part of its built-in functionality.

Join telegram for free gold btcusd and usoil signals
t.me/+viyq6E0EBl82MmY8
t.me/+viyq6E0EBl82MmY8
Disclaimer
The information and publications are not meant to be, and do not constitute, financial, investment, trading, or other types of advice or recommendations supplied or endorsed by TradingView. Read more in the Terms of Use.
Join telegram for free gold btcusd and usoil signals
t.me/+viyq6E0EBl82MmY8
t.me/+viyq6E0EBl82MmY8
Disclaimer
The information and publications are not meant to be, and do not constitute, financial, investment, trading, or other types of advice or recommendations supplied or endorsed by TradingView. Read more in the Terms of Use.