4theluv Full Sector Monitor (v7.1)
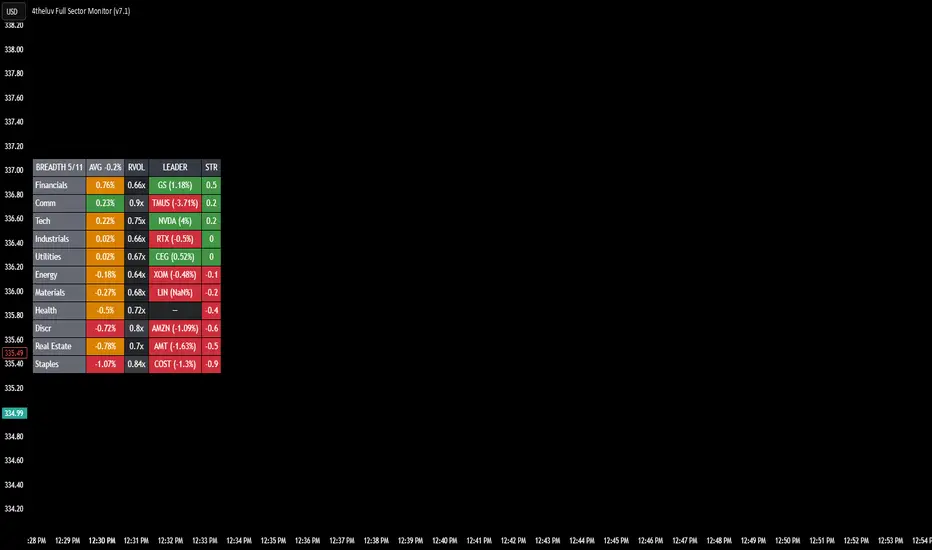
A real-time, single-glance dashboard of all 11 S&P 500 sectors — sorted by performance, weighted by conviction, and annotated with the stocks actually doing the moving. Built for traders who want to know where the money is flowing right now without flipping through 11 charts.
🎯 What It Does
This indicator displays a sortable table showing:
% change for each of the 11 SPDR sector ETFs (XLK, XLF, XLV, XLY, XLP, XLE, XLI, XLB, XLU, XLC, XLRE)
Relative volume (RVOL) vs. the 20-period average — your conviction gauge
Leader stock within each sector (the biggest mover in each sector's top-weight pool)
Strength score combining % change and volume conviction
Breadth header showing how many sectors are green and the average move
Sectors auto-sort top-to-bottom by % change every bar, so the strongest sector is always at the top.
📖 How To Read The Table
Header Row
Cell Meaning
BREADTH X/11 How many sectors are positive. ≥7 green = bullish tape, ≤4 = bearish tape, in-between = mixed
AVG X.XX% Equal-weighted average % change across all 11 sectors. A quick "market pulse"
RVOL / LEADER / STR Column headers
Data Rows (sorted by % change, descending)
Column 1 — Sector Name
Plain English: Tech, Financials, Health, Discr (Discretionary), Staples, Energy, Industrials, Materials, Utilities, Comm (Communications), Real Estate.
Column 2 — % Change
The ETF's move on your selected timeframe.
🟢 Green = positive move with healthy volume
🔴 Red = negative move with healthy volume
🟠 Orange = move happening on weak volume (RVOL < 0.8) — treat with skepticism
Column 3 — RVOL (Relative Volume)
Current volume ÷ 20-period average volume.
Aqua/cyan highlight = RVOL ≥ 1.2× → strong participation, real conviction
Medium gray = normal volume (0.8× – 1.2×)
Light gray = RVOL < 0.8× → thin, unconvincing move
Column 4 — Leader
The single biggest mover (by absolute %) from that sector's top-weighted holdings, displayed as TICKER (X.XX%). Color matches direction. Health shows — (no leader pool to save calculation overhead).
Column 5 — STR (Strength)
% change × min(RVOL, 3). A composite score that rewards moves with volume behind them. RVOL is capped at 3× so a single volume spike can't dominate. Bigger number = higher conviction move, in either direction.
💡 Tooltips
Hover any cell to see the full sector breakdown: leader pool stocks, ETF %, RVOL, strength score, and conviction warnings.
🧠 How To Trade With It
1. Identify Sector Rotation
Look at the top 2–3 sectors. Are they offensive (Tech, Discr, Comm) or defensive (Staples, Utilities, Health)? That tells you the market's risk appetite right now.
Offensive leading + green breadth → risk-on environment, favor growth/momentum longs
Defensive leading + red breadth → risk-off, look for shorts or hedges
Energy/Materials leading → often reflation or commodity narrative
Financials leading → often a yield curve / rates story
2. Confirm With RVOL
A sector up +0.8% on 0.4× RVOL is noise. The same +0.8% on 1.8× RVOL is real. Always check the RVOL column before acting on the % change. The orange "weak conviction" coloring is your tell.
3. Use The Leader Column For Trade Ideas
The leader is doing the heavy lifting in that sector. Pull it up on a chart:
If the leader is extended, look for the #2 weight as a catch-up trade
If the leader is breaking out on volume, the whole sector ETF is likely tradeable
If the sector is green but the leader is red, something's off — investigate before trading
4. Watch The Breadth Number
9–11 green → trend day up, fade shorts, ride longs
0–2 green → trend day down, fade longs
5–6 green → choppy/rotational tape, trade ranges and pairs, not breakouts
5. Strength Column For Ranking
When two sectors have similar %, the one with higher STR has more institutional volume behind it. Prefer the higher-STR sector for swing entries.
⚙️ Settings Guide
Position & Size
Table Position — 9 placement options around the chart
Text Size — tiny / small / normal / large
Dashboard Timeframe — what timeframe to calculate moves on. Default 30 (30 min). Try D for daily rotation, 60 for intraday swings, 5 for scalping
Use Extended Hours — includes pre-market/after-hours price action. Recommended ON for early-session reads
Color Theme
Customize positive/negative/weak colors and background transparency to match your chart theme.
Signals
Strong RVOL threshold (default 1.2) — when RVOL gets the aqua highlight
Weak RVOL threshold (default 0.8) — when moves get orange "low conviction" warning
📊 Sector Leader Pools
Each sector pulls from these top-weighted holdings:
Sector Leader Pool
Tech (XLK) NVDA, AAPL, MSFT, AVGO
Comm (XLC) META, GOOGL, NFLX, TMUS
Discr (XLY) AMZN, TSLA, HD
Financials (XLF) JPM, V, GS
Energy (XLE) XOM, CVX, COP
Industrials (XLI) GE, CAT, RTX
Staples (XLP) COST, WMT
Materials (XLB) LIN, SHW
Utilities (XLU) NEE, CEG
Real Estate (XLRE) AMT, PLD
Health (XLV) ETF only
⚡ Performance Notes
Uses 39 request.security calls — fits comfortably under TradingView's 40-call limit on most plan tiers
Renders only on the last bar (barstate.islast) for zero historical-bar overhead
All calculations are bar-close based — no repainting
🔄 Best Used With
A 1-minute or 5-minute chart of SPY/QQQ for context
Your normal scanner/watchlist
A correlation tool if you trade pairs
📝 Changelog
v7.1 — Optimized to 39 security calls, added breadth header, strength score, conviction-aware coloring, tooltips, and weak-RVOL warnings. Health sector simplified to ETF-only.
v6.8 — Original 11-sector dashboard with 2-stock leader pools.
⚠️ Disclaimer
This indicator is for educational and informational purposes only. It does not constitute financial advice. Past performance and relative strength do not guarantee future results. Always do your own research and manage risk appropriately.
If you find this useful, drop a 🚀 and a follow. Suggestions and bug reports welcome in the comments.
Quick reference cheat sheet (paste at the top of your notes):
🟢 Green % + Aqua RVOL = Real move, follow it
🔴 Red % + Aqua RVOL = Real selling, respect it
🟠 Orange % anything = Weak conviction, ignore or fade
Breadth ≥7 = Risk-on, ≤4 = Risk-off, 5-6 = Chop
STR > 2.0 = High-conviction move worth a trade
Good luck and happy hunting. 🎯
🎯 What It Does
This indicator displays a sortable table showing:
% change for each of the 11 SPDR sector ETFs (XLK, XLF, XLV, XLY, XLP, XLE, XLI, XLB, XLU, XLC, XLRE)
Relative volume (RVOL) vs. the 20-period average — your conviction gauge
Leader stock within each sector (the biggest mover in each sector's top-weight pool)
Strength score combining % change and volume conviction
Breadth header showing how many sectors are green and the average move
Sectors auto-sort top-to-bottom by % change every bar, so the strongest sector is always at the top.
📖 How To Read The Table
Header Row
Cell Meaning
BREADTH X/11 How many sectors are positive. ≥7 green = bullish tape, ≤4 = bearish tape, in-between = mixed
AVG X.XX% Equal-weighted average % change across all 11 sectors. A quick "market pulse"
RVOL / LEADER / STR Column headers
Data Rows (sorted by % change, descending)
Column 1 — Sector Name
Plain English: Tech, Financials, Health, Discr (Discretionary), Staples, Energy, Industrials, Materials, Utilities, Comm (Communications), Real Estate.
Column 2 — % Change
The ETF's move on your selected timeframe.
🟢 Green = positive move with healthy volume
🔴 Red = negative move with healthy volume
🟠 Orange = move happening on weak volume (RVOL < 0.8) — treat with skepticism
Column 3 — RVOL (Relative Volume)
Current volume ÷ 20-period average volume.
Aqua/cyan highlight = RVOL ≥ 1.2× → strong participation, real conviction
Medium gray = normal volume (0.8× – 1.2×)
Light gray = RVOL < 0.8× → thin, unconvincing move
Column 4 — Leader
The single biggest mover (by absolute %) from that sector's top-weighted holdings, displayed as TICKER (X.XX%). Color matches direction. Health shows — (no leader pool to save calculation overhead).
Column 5 — STR (Strength)
% change × min(RVOL, 3). A composite score that rewards moves with volume behind them. RVOL is capped at 3× so a single volume spike can't dominate. Bigger number = higher conviction move, in either direction.
💡 Tooltips
Hover any cell to see the full sector breakdown: leader pool stocks, ETF %, RVOL, strength score, and conviction warnings.
🧠 How To Trade With It
1. Identify Sector Rotation
Look at the top 2–3 sectors. Are they offensive (Tech, Discr, Comm) or defensive (Staples, Utilities, Health)? That tells you the market's risk appetite right now.
Offensive leading + green breadth → risk-on environment, favor growth/momentum longs
Defensive leading + red breadth → risk-off, look for shorts or hedges
Energy/Materials leading → often reflation or commodity narrative
Financials leading → often a yield curve / rates story
2. Confirm With RVOL
A sector up +0.8% on 0.4× RVOL is noise. The same +0.8% on 1.8× RVOL is real. Always check the RVOL column before acting on the % change. The orange "weak conviction" coloring is your tell.
3. Use The Leader Column For Trade Ideas
The leader is doing the heavy lifting in that sector. Pull it up on a chart:
If the leader is extended, look for the #2 weight as a catch-up trade
If the leader is breaking out on volume, the whole sector ETF is likely tradeable
If the sector is green but the leader is red, something's off — investigate before trading
4. Watch The Breadth Number
9–11 green → trend day up, fade shorts, ride longs
0–2 green → trend day down, fade longs
5–6 green → choppy/rotational tape, trade ranges and pairs, not breakouts
5. Strength Column For Ranking
When two sectors have similar %, the one with higher STR has more institutional volume behind it. Prefer the higher-STR sector for swing entries.
⚙️ Settings Guide
Position & Size
Table Position — 9 placement options around the chart
Text Size — tiny / small / normal / large
Dashboard Timeframe — what timeframe to calculate moves on. Default 30 (30 min). Try D for daily rotation, 60 for intraday swings, 5 for scalping
Use Extended Hours — includes pre-market/after-hours price action. Recommended ON for early-session reads
Color Theme
Customize positive/negative/weak colors and background transparency to match your chart theme.
Signals
Strong RVOL threshold (default 1.2) — when RVOL gets the aqua highlight
Weak RVOL threshold (default 0.8) — when moves get orange "low conviction" warning
📊 Sector Leader Pools
Each sector pulls from these top-weighted holdings:
Sector Leader Pool
Tech (XLK) NVDA, AAPL, MSFT, AVGO
Comm (XLC) META, GOOGL, NFLX, TMUS
Discr (XLY) AMZN, TSLA, HD
Financials (XLF) JPM, V, GS
Energy (XLE) XOM, CVX, COP
Industrials (XLI) GE, CAT, RTX
Staples (XLP) COST, WMT
Materials (XLB) LIN, SHW
Utilities (XLU) NEE, CEG
Real Estate (XLRE) AMT, PLD
Health (XLV) ETF only
⚡ Performance Notes
Uses 39 request.security calls — fits comfortably under TradingView's 40-call limit on most plan tiers
Renders only on the last bar (barstate.islast) for zero historical-bar overhead
All calculations are bar-close based — no repainting
🔄 Best Used With
A 1-minute or 5-minute chart of SPY/QQQ for context
Your normal scanner/watchlist
A correlation tool if you trade pairs
📝 Changelog
v7.1 — Optimized to 39 security calls, added breadth header, strength score, conviction-aware coloring, tooltips, and weak-RVOL warnings. Health sector simplified to ETF-only.
v6.8 — Original 11-sector dashboard with 2-stock leader pools.
⚠️ Disclaimer
This indicator is for educational and informational purposes only. It does not constitute financial advice. Past performance and relative strength do not guarantee future results. Always do your own research and manage risk appropriately.
If you find this useful, drop a 🚀 and a follow. Suggestions and bug reports welcome in the comments.
Quick reference cheat sheet (paste at the top of your notes):
🟢 Green % + Aqua RVOL = Real move, follow it
🔴 Red % + Aqua RVOL = Real selling, respect it
🟠 Orange % anything = Weak conviction, ignore or fade
Breadth ≥7 = Risk-on, ≤4 = Risk-off, 5-6 = Chop
STR > 2.0 = High-conviction move worth a trade
Good luck and happy hunting. 🎯

You can always take more, you can never take less.
Disclaimer
The information and publications are not meant to be, and do not constitute, financial, investment, trading, or other types of advice or recommendations supplied or endorsed by TradingView. Read more in the Terms of Use.
You can always take more, you can never take less.
Disclaimer
The information and publications are not meant to be, and do not constitute, financial, investment, trading, or other types of advice or recommendations supplied or endorsed by TradingView. Read more in the Terms of Use.