OPEN-SOURCE SCRIPT
Zen Measured Moves - Price Extension Targets Based on Prior Bar
Overview
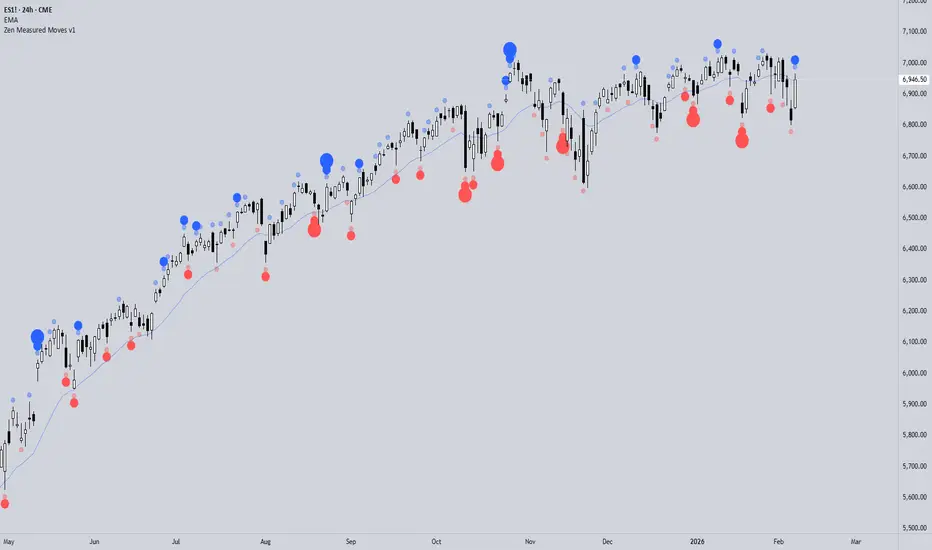
Zen Measured Moves identifies potential price extension targets by projecting the prior bar's range forward from breakout points. This indicator helps traders anticipate how far price might travel after breaking above a prior high or below a prior low.
How It Works
The indicator calculates three measured move targets in each direction:
Bullish Targets (from prior bar's high):
0.5x - Half the prior range (50% extension)
1x - Full prior range (100% extension)
2x - Double the prior range (200% extension)
Bearish Targets (from prior bar's low):
0.5x - Half the prior range (50% extension)
1x - Full prior range (100% extension)
2x - Double the prior range (200% extension)
Visual Signals
Blue circles above bars indicate bullish measured moves achieved:
Light blue (tiny) = 0.5x target hit
Medium blue (small) = 1x target hit
Dark blue (normal) = 2x target hit
Red circles below bars indicate bearish measured moves achieved:
Light red (tiny) = 0.5x target hit
Medium red (small) = 1x target hit
Dark red (normal) = 2x target hit
Data Window Outputs
All calculated values are available in the Data Window for analysis or export to Excel:
Target hit indicators (1/0 boolean values)
Actual target price levels
Bar type classifications (bullish/bearish)
Range measurements
Internal Bar Strength (IBS) values
Use Cases
Identify potential profit targets after breakouts
Gauge momentum strength by which targets are reached
Filter for high-momentum vs low-momentum moves
Backtest measured move reliability on your instruments
Export data for statistical analysis in Excel
Best Practices
Works on any timeframe or instrument
Most effective when prior bar has clear directional bias
Consider combining with volume or other confirmation indicators
Use IBS values to assess entry/exit quality within bars
Zen Measured Moves identifies potential price extension targets by projecting the prior bar's range forward from breakout points. This indicator helps traders anticipate how far price might travel after breaking above a prior high or below a prior low.
How It Works
The indicator calculates three measured move targets in each direction:
Bullish Targets (from prior bar's high):
0.5x - Half the prior range (50% extension)
1x - Full prior range (100% extension)
2x - Double the prior range (200% extension)
Bearish Targets (from prior bar's low):
0.5x - Half the prior range (50% extension)
1x - Full prior range (100% extension)
2x - Double the prior range (200% extension)
Visual Signals
Blue circles above bars indicate bullish measured moves achieved:
Light blue (tiny) = 0.5x target hit
Medium blue (small) = 1x target hit
Dark blue (normal) = 2x target hit
Red circles below bars indicate bearish measured moves achieved:
Light red (tiny) = 0.5x target hit
Medium red (small) = 1x target hit
Dark red (normal) = 2x target hit
Data Window Outputs
All calculated values are available in the Data Window for analysis or export to Excel:
Target hit indicators (1/0 boolean values)
Actual target price levels
Bar type classifications (bullish/bearish)
Range measurements
Internal Bar Strength (IBS) values
Use Cases
Identify potential profit targets after breakouts
Gauge momentum strength by which targets are reached
Filter for high-momentum vs low-momentum moves
Backtest measured move reliability on your instruments
Export data for statistical analysis in Excel
Best Practices
Works on any timeframe or instrument
Most effective when prior bar has clear directional bias
Consider combining with volume or other confirmation indicators
Use IBS values to assess entry/exit quality within bars
Open-source script
In true TradingView spirit, the creator of this script has made it open-source, so that traders can review and verify its functionality. Kudos to the author! While you can use it for free, remember that republishing the code is subject to our House Rules.

Disclaimer
The information and publications are not meant to be, and do not constitute, financial, investment, trading, or other types of advice or recommendations supplied or endorsed by TradingView. Read more in the Terms of Use.
Open-source script
In true TradingView spirit, the creator of this script has made it open-source, so that traders can review and verify its functionality. Kudos to the author! While you can use it for free, remember that republishing the code is subject to our House Rules.
Disclaimer
The information and publications are not meant to be, and do not constitute, financial, investment, trading, or other types of advice or recommendations supplied or endorsed by TradingView. Read more in the Terms of Use.