Eye Smart VWAP [EyeAlgo]
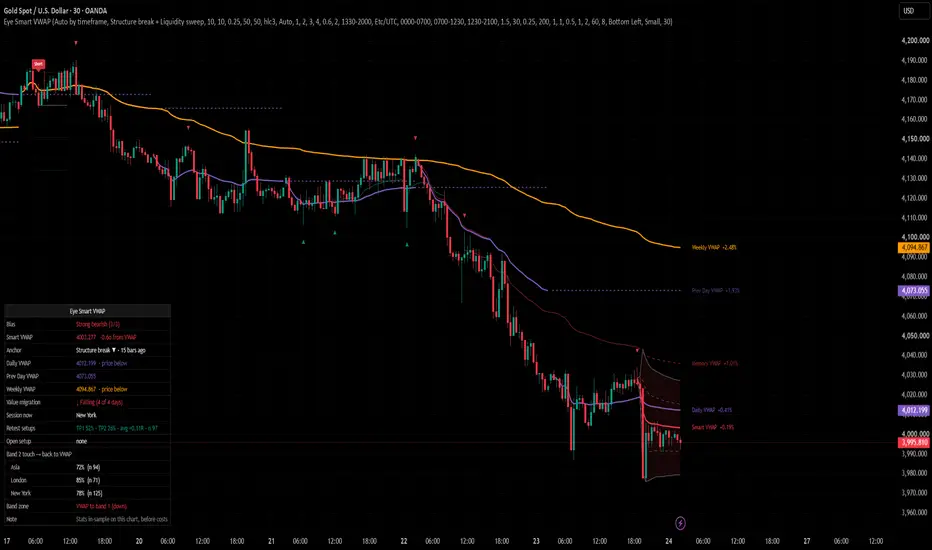
Eye Smart VWAP anchors a VWAP on its own at the point where a move started (a confirmed structure break or a liquidity sweep of a swing), draws standard-deviation bands around it, and measures how price has reacted to those bands on your own chart.

Why this VWAP
A session VWAP resets every day, so it often has nothing to do with the move you are trading. An anchored VWAP fixes that, but you either place the anchor by hand or use a fixed rule such as the highest high or lowest low of a period. Eye Smart VWAP anchors on market-structure events instead, keeps the older anchors and a Memory VWAP on the chart, and uses the Daily and Weekly VWAP inside the script: they filter the retest setups and feed the Bias row, and all levels are named together at the right edge so you can see the nearest one.
It answers three questions:
▶ Where is the average price of the traders who started this move?
▶ Is price stretched away from that average, or close to it?
▶ When price reached the outer band in the past on this symbol, how often did it come back to the VWAP?
What is different here
▶ Structure anchor: when price closes beyond the last confirmed swing, the VWAP is anchored on the lowest low (or highest high) of the move that broke it.
▶ Sweep anchor: when a wick runs a swing level by a minimum ATR distance and the candle closes back inside, the VWAP is anchored on that sweep candle.
▶ Memory VWAP: the previous anchor keeps running as a dashed line, so the old and the new average price can be compared as support and resistance.
▶ Band 2 statistics split by session (Asia, London, New York), counted on the chart you are looking at.
▶ Retest trade plans with Entry, Stop, TP1 and TP2, and a running record (TP1 %, TP2 %, average R).
▶ Volume-safe weighting: on feeds without real volume it uses candle range for the whole symbol, so lines and bands never go blank.
▶ Value migration: compares the last daily VWAP closes to show whether value is moving up, down or sideways.
"Highest volume bar" and "Origin of N-bar range" are included as standard alternative anchors.
How it works
1. Swings: confirmed pivot highs and lows ("Swing length") mark the levels that matter.
2. Anchor: a close beyond a swing (structure break) or a wick through it that closes back (liquidity sweep) sets a new anchor. "Min bars between anchors" is counted from the bar where the last anchor was decided, so the line cannot re-anchor on every bar.
3. VWAP and bands: from the anchor, price is averaged with volume weights. The bands are the volume-weighted standard deviation × "Band 1 (σ)", "Band 2 (σ)" and "Band 3 (σ)".
4. Retest setup: on a bullish anchor (bearish for shorts), once price has been at least 1.5 σ from the Smart VWAP within the last 30 bars (2 σ on the Scalp preset), the first candle that dips into the retest zone and closes back above the VWAP as a bullish candle gives a Long plan. Default filters: same side of the Daily and Weekly VWAP, and the Smart VWAP sloping with the trade (each can be switched off; an EMA filter is optional). The stop sits beyond the VWAP by "Stop beyond VWAP (σ)", never closer than "Min stop (× ATR)". TP1 and TP2 are R multiples.
5. Statistics: each time price crosses into band 2 (while no earlier touch on that side is still open), the next bars are followed for "Band 2 touch result window (bars)". It counts as "back to VWAP" if price reaches the Smart VWAP before band 3 or the time limit; a bar that reaches both counts as a fail. Results are grouped by the session in which the touch happened. Touches are ignored for the first 10 bars of a new anchor and while 1 σ is smaller than 0.3 ATR (bands too narrow to mean anything), and an open touch is cancelled when the Smart VWAP re-anchors.
How the retest record is counted
Half of the position is closed at TP1 and the stop moves to entry; the other half closes at TP2 or at entry. If no stop or target is reached within "Max bars in trade", the trade closes at that bar's close. If one bar reaches both the stop and a target, the stop is counted. Fills are assumed exactly at the levels; gaps, spread and slippage are not modelled.

What the dashboard showed in testing
OANDA:XAUUSD, 30 minutes, default settings, the history TradingView loads (checked 25 Oct 2026):
▶ Band 2 touch → back to VWAP: Asia 72% (n 94), London 85% (n 71), New York 78% (n 125).
▶ Retest setups: TP1 reached 52%, TP2 reached 26%, average +0.11R (n 97).
These numbers are in-sample, before spread and commission, and change with symbol, timeframe and settings. After costs, an average this small can be close to zero. They describe the past on one chart and are not a promise of future results. Check the dashboard on your own symbol and timeframe.
How to use
1. Add the indicator. Leave "Preset" on "Auto by timeframe"; it picks swing length, anchor gap and retest distance for your timeframe.
2. Read the Bias row: it adds three checks: Smart VWAP colour (green = bullish anchor, red = bearish anchor), price above/below the Smart VWAP, and price above/below the Daily VWAP. "Strong bullish (3/3)" means all three agree.
3. Trend: wait for price to stretch away, then use the first pullback into the Smart VWAP (the Long/Short retest plan) in the trend direction.
4. Range: band 2 and band 3 are stretch zones. The session rows of "Band 2 touch → back to VWAP" show how often a return to the VWAP happened on this symbol.
5. Use the Memory VWAP, Prev Day VWAP and Weekly VWAP as levels where the move may react.
6. Set alerts (below) instead of watching the chart.
How to change settings
Open the settings by double-clicking the indicator name.
Quick guide:
▶ Fewer, bigger anchors → set "Preset" to "Custom (use inputs below)" and raise "Swing length" or "Min bars between anchors".
▶ Only sweeps or only structure → "Anchor on". Other options: "Every confirmed swing", "Highest volume bar", "Origin of N-bar range".
▶ Wider or tighter bands → "Band 1 (σ)", "Band 2 (σ)", "Band 3 (σ)".
▶ Cleaner chart → lower "Past Smart VWAPs kept on chart", or turn off "Memory VWAP (previous anchor keeps running)" or "Anchor marks".
▶ Futures cash session → turn on "Custom session VWAP (e.g. RTH)" and set "Custom session window" and "Timezone".
▶ Line names too close at the right edge → raise "Right label spacing (× ATR)".
Settings
▶ Quick setup: Preset.
▶ Smart VWAP (auto anchor): Anchor on, Swing length, Min bars between anchors, Sweep min wick beyond level (× ATR), Highest volume bar lookback, N-bar range length, Price source (hlc3 matches TradingView's own VWAP), Weighting (Auto / Volume / Range).
▶ Smart VWAP bands: Band 1/2/3 (σ), show each band, fill inside band 2, Color candles by band zone, Past Smart VWAPs kept on chart, Memory VWAP, Anchor marks, Right label spacing.
▶ Period VWAPs: Daily (with bands), Previous Day, Weekly (with bands), Previous Week, Monthly, Multi-day VWAP (rolling: today + previous N-1 days, 2-5 days), Session VWAP (Asia / London / New York), Custom session VWAP.
▶ Sessions: Timezone and the Asia / London / New York windows used for the Session VWAP and the statistics.
▶ Retest setups: show or hide setups, move-away distance and bars, retest zone, filters (Daily VWAP side, Weekly VWAP side, VWAP slope, optional EMA trend with its length and "Show EMA line"), Max retests per anchor, stop, TP1/TP2 in R, Max bars in trade, Trade plans kept on chart.
▶ Dashboard: show or hide, position, text size, Band 2 touch result window.
▶ Colors.
Alerts
▶ Smart VWAP re-anchored
▶ Long retest setup / Short retest setup
▶ Price crossed above Smart VWAP / Price crossed below Smart VWAP
▶ Touch upper band 2 / Touch lower band 2
▶ Rejected at upper band 2 / Rejected at lower band 2 (touched and closed back inside)
▶ Daily VWAP cross
For one alert with full details, choose "Any alert() function call": it sends the new anchor reason, or the setup side with entry, stop, TP1 and TP2. All alerts are checked on bar close.
Notes and limits
▶ Back-drawing: a new anchor is decided only on a closed bar. The line and the anchor mark are then drawn back to the origin of the move (up to 300 bars for a structure break, "Swing length" bars for "Every confirmed swing", up to "N-bar range length" for the N-bar mode). On history you therefore see a line that did not exist on those bars in real time. Setups, statistics, alerts and the Data Window values use only the VWAP that was known on each bar, never the back-drawn line. On the live bar the VWAP and bands move with price, like any VWAP.
▶ Swings need "Swing length" bars on the right to confirm, so a swing level is known only after that delay.
▶ Statistics use only the bars loaded on your chart, so they change when you scroll back, change timeframe or reload.
▶ On symbols without volume the line is range-weighted and differs from a volume VWAP; "Highest volume bar" then means the largest-range bar.
▶ Session rows show "no data yet" on timeframes of one day and above.
▶ TradingView limits the number of lines, labels and polylines per script; older anchors and plans are removed first.
▶ The indicator does not place trades.
Disclaimer
For education and research only. This is not financial advice. Past results on a chart do not guarantee future results. Test the settings and the timeframe on your own instrument before using any idea from it.
Why this VWAP
A session VWAP resets every day, so it often has nothing to do with the move you are trading. An anchored VWAP fixes that, but you either place the anchor by hand or use a fixed rule such as the highest high or lowest low of a period. Eye Smart VWAP anchors on market-structure events instead, keeps the older anchors and a Memory VWAP on the chart, and uses the Daily and Weekly VWAP inside the script: they filter the retest setups and feed the Bias row, and all levels are named together at the right edge so you can see the nearest one.
It answers three questions:
▶ Where is the average price of the traders who started this move?
▶ Is price stretched away from that average, or close to it?
▶ When price reached the outer band in the past on this symbol, how often did it come back to the VWAP?
What is different here
▶ Structure anchor: when price closes beyond the last confirmed swing, the VWAP is anchored on the lowest low (or highest high) of the move that broke it.
▶ Sweep anchor: when a wick runs a swing level by a minimum ATR distance and the candle closes back inside, the VWAP is anchored on that sweep candle.
▶ Memory VWAP: the previous anchor keeps running as a dashed line, so the old and the new average price can be compared as support and resistance.
▶ Band 2 statistics split by session (Asia, London, New York), counted on the chart you are looking at.
▶ Retest trade plans with Entry, Stop, TP1 and TP2, and a running record (TP1 %, TP2 %, average R).
▶ Volume-safe weighting: on feeds without real volume it uses candle range for the whole symbol, so lines and bands never go blank.
▶ Value migration: compares the last daily VWAP closes to show whether value is moving up, down or sideways.
"Highest volume bar" and "Origin of N-bar range" are included as standard alternative anchors.
How it works
1. Swings: confirmed pivot highs and lows ("Swing length") mark the levels that matter.
2. Anchor: a close beyond a swing (structure break) or a wick through it that closes back (liquidity sweep) sets a new anchor. "Min bars between anchors" is counted from the bar where the last anchor was decided, so the line cannot re-anchor on every bar.
3. VWAP and bands: from the anchor, price is averaged with volume weights. The bands are the volume-weighted standard deviation × "Band 1 (σ)", "Band 2 (σ)" and "Band 3 (σ)".
4. Retest setup: on a bullish anchor (bearish for shorts), once price has been at least 1.5 σ from the Smart VWAP within the last 30 bars (2 σ on the Scalp preset), the first candle that dips into the retest zone and closes back above the VWAP as a bullish candle gives a Long plan. Default filters: same side of the Daily and Weekly VWAP, and the Smart VWAP sloping with the trade (each can be switched off; an EMA filter is optional). The stop sits beyond the VWAP by "Stop beyond VWAP (σ)", never closer than "Min stop (× ATR)". TP1 and TP2 are R multiples.
5. Statistics: each time price crosses into band 2 (while no earlier touch on that side is still open), the next bars are followed for "Band 2 touch result window (bars)". It counts as "back to VWAP" if price reaches the Smart VWAP before band 3 or the time limit; a bar that reaches both counts as a fail. Results are grouped by the session in which the touch happened. Touches are ignored for the first 10 bars of a new anchor and while 1 σ is smaller than 0.3 ATR (bands too narrow to mean anything), and an open touch is cancelled when the Smart VWAP re-anchors.
How the retest record is counted
Half of the position is closed at TP1 and the stop moves to entry; the other half closes at TP2 or at entry. If no stop or target is reached within "Max bars in trade", the trade closes at that bar's close. If one bar reaches both the stop and a target, the stop is counted. Fills are assumed exactly at the levels; gaps, spread and slippage are not modelled.
What the dashboard showed in testing
OANDA:XAUUSD, 30 minutes, default settings, the history TradingView loads (checked 25 Oct 2026):
▶ Band 2 touch → back to VWAP: Asia 72% (n 94), London 85% (n 71), New York 78% (n 125).
▶ Retest setups: TP1 reached 52%, TP2 reached 26%, average +0.11R (n 97).
These numbers are in-sample, before spread and commission, and change with symbol, timeframe and settings. After costs, an average this small can be close to zero. They describe the past on one chart and are not a promise of future results. Check the dashboard on your own symbol and timeframe.
How to use
1. Add the indicator. Leave "Preset" on "Auto by timeframe"; it picks swing length, anchor gap and retest distance for your timeframe.
2. Read the Bias row: it adds three checks: Smart VWAP colour (green = bullish anchor, red = bearish anchor), price above/below the Smart VWAP, and price above/below the Daily VWAP. "Strong bullish (3/3)" means all three agree.
3. Trend: wait for price to stretch away, then use the first pullback into the Smart VWAP (the Long/Short retest plan) in the trend direction.
4. Range: band 2 and band 3 are stretch zones. The session rows of "Band 2 touch → back to VWAP" show how often a return to the VWAP happened on this symbol.
5. Use the Memory VWAP, Prev Day VWAP and Weekly VWAP as levels where the move may react.
6. Set alerts (below) instead of watching the chart.
How to change settings
Open the settings by double-clicking the indicator name.
Quick guide:
▶ Fewer, bigger anchors → set "Preset" to "Custom (use inputs below)" and raise "Swing length" or "Min bars between anchors".
▶ Only sweeps or only structure → "Anchor on". Other options: "Every confirmed swing", "Highest volume bar", "Origin of N-bar range".
▶ Wider or tighter bands → "Band 1 (σ)", "Band 2 (σ)", "Band 3 (σ)".
▶ Cleaner chart → lower "Past Smart VWAPs kept on chart", or turn off "Memory VWAP (previous anchor keeps running)" or "Anchor marks".
▶ Futures cash session → turn on "Custom session VWAP (e.g. RTH)" and set "Custom session window" and "Timezone".
▶ Line names too close at the right edge → raise "Right label spacing (× ATR)".
Settings
▶ Quick setup: Preset.
▶ Smart VWAP (auto anchor): Anchor on, Swing length, Min bars between anchors, Sweep min wick beyond level (× ATR), Highest volume bar lookback, N-bar range length, Price source (hlc3 matches TradingView's own VWAP), Weighting (Auto / Volume / Range).
▶ Smart VWAP bands: Band 1/2/3 (σ), show each band, fill inside band 2, Color candles by band zone, Past Smart VWAPs kept on chart, Memory VWAP, Anchor marks, Right label spacing.
▶ Period VWAPs: Daily (with bands), Previous Day, Weekly (with bands), Previous Week, Monthly, Multi-day VWAP (rolling: today + previous N-1 days, 2-5 days), Session VWAP (Asia / London / New York), Custom session VWAP.
▶ Sessions: Timezone and the Asia / London / New York windows used for the Session VWAP and the statistics.
▶ Retest setups: show or hide setups, move-away distance and bars, retest zone, filters (Daily VWAP side, Weekly VWAP side, VWAP slope, optional EMA trend with its length and "Show EMA line"), Max retests per anchor, stop, TP1/TP2 in R, Max bars in trade, Trade plans kept on chart.
▶ Dashboard: show or hide, position, text size, Band 2 touch result window.
▶ Colors.
Alerts
▶ Smart VWAP re-anchored
▶ Long retest setup / Short retest setup
▶ Price crossed above Smart VWAP / Price crossed below Smart VWAP
▶ Touch upper band 2 / Touch lower band 2
▶ Rejected at upper band 2 / Rejected at lower band 2 (touched and closed back inside)
▶ Daily VWAP cross
For one alert with full details, choose "Any alert() function call": it sends the new anchor reason, or the setup side with entry, stop, TP1 and TP2. All alerts are checked on bar close.
Notes and limits
▶ Back-drawing: a new anchor is decided only on a closed bar. The line and the anchor mark are then drawn back to the origin of the move (up to 300 bars for a structure break, "Swing length" bars for "Every confirmed swing", up to "N-bar range length" for the N-bar mode). On history you therefore see a line that did not exist on those bars in real time. Setups, statistics, alerts and the Data Window values use only the VWAP that was known on each bar, never the back-drawn line. On the live bar the VWAP and bands move with price, like any VWAP.
▶ Swings need "Swing length" bars on the right to confirm, so a swing level is known only after that delay.
▶ Statistics use only the bars loaded on your chart, so they change when you scroll back, change timeframe or reload.
▶ On symbols without volume the line is range-weighted and differs from a volume VWAP; "Highest volume bar" then means the largest-range bar.
▶ Session rows show "no data yet" on timeframes of one day and above.
▶ TradingView limits the number of lines, labels and polylines per script; older anchors and plans are removed first.
▶ The indicator does not place trades.
Disclaimer
For education and research only. This is not financial advice. Past results on a chart do not guarantee future results. Test the settings and the timeframe on your own instrument before using any idea from it.

Disclaimer
The information and publications are not meant to be, and do not constitute, financial, investment, trading, or other types of advice or recommendations supplied or endorsed by TradingView. Read more in the Terms of Use.
Disclaimer
The information and publications are not meant to be, and do not constitute, financial, investment, trading, or other types of advice or recommendations supplied or endorsed by TradingView. Read more in the Terms of Use.