OPEN-SOURCE SCRIPT
Price change area
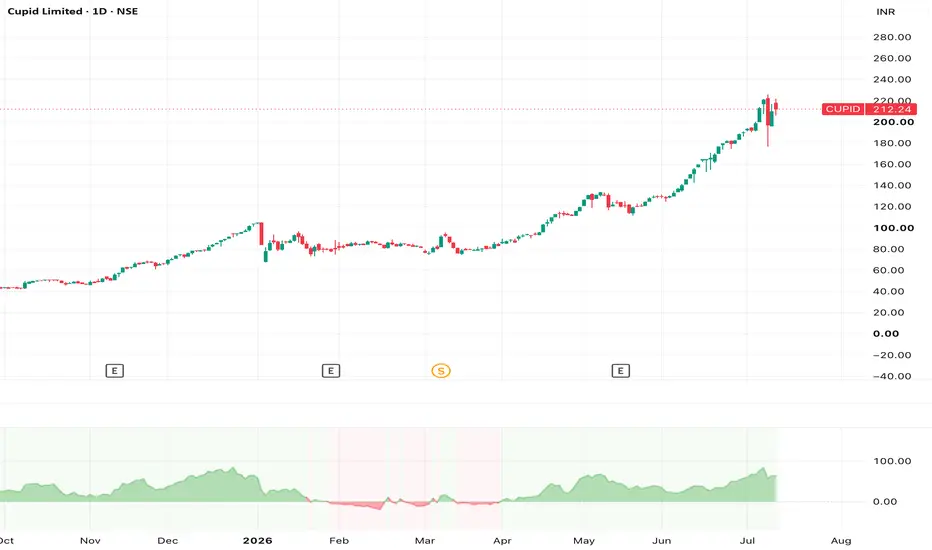
This indicator visualizes how much the price has changed over a configurable lookback period, displayed as a continuous area in a separate pane.
Features
• Two calculation modes:
• Exact % change – compares today’s close to the close exactly y bars ago.
• Max % change – shows the largest % move from an extreme (lowest or highest close) in the last y bars to today’s close.
• Configurable lookback: set the number of bars y (default: 30).
• Y-axis scale options:
• Ratio – displays values like 0.33 , -0.20 (i.e., +33%, −20%).
• Percent – displays values like 33.3 , -20.0 .
• Color-coded area:
• Green for positive change (price up over the lookback).
• Red for negative change (price down over the lookback).
• Zero line = no change.
How it works
• Uses closing prices only.
• For each bar, computes:
• Exact mode:
• Max mode:
• Finds lowest and highest close in the last y bars.
• Calculates up and down ratios from those extremes to today’s close.
• Plots the one with the larger absolute deviation from 1.
• Plots (ratio − 1) (or (ratio − 1) × 100 in Percent mode) as a filled area around the zero line.
Use cases
• Quickly spot strong up/down moves over a chosen period.
• Study historical volatility and momentum in terms of % change.
• Compare how different stocks or timeframes behave over similar lookback windows.
Inputs
• Lookback bars (y): number of bars to consider (default 30).
• Calculation Mode: “Exact % change” or “Max % change”.
• Y-Axis Scale: “Ratio” or “Percent”.
Features
• Two calculation modes:
• Exact % change – compares today’s close to the close exactly y bars ago.
• Max % change – shows the largest % move from an extreme (lowest or highest close) in the last y bars to today’s close.
• Configurable lookback: set the number of bars y (default: 30).
• Y-axis scale options:
• Ratio – displays values like 0.33 , -0.20 (i.e., +33%, −20%).
• Percent – displays values like 33.3 , -20.0 .
• Color-coded area:
• Green for positive change (price up over the lookback).
• Red for negative change (price down over the lookback).
• Zero line = no change.
How it works
• Uses closing prices only.
• For each bar, computes:
• Exact mode:
• Max mode:
• Finds lowest and highest close in the last y bars.
• Calculates up and down ratios from those extremes to today’s close.
• Plots the one with the larger absolute deviation from 1.
• Plots (ratio − 1) (or (ratio − 1) × 100 in Percent mode) as a filled area around the zero line.
Use cases
• Quickly spot strong up/down moves over a chosen period.
• Study historical volatility and momentum in terms of % change.
• Compare how different stocks or timeframes behave over similar lookback windows.
Inputs
• Lookback bars (y): number of bars to consider (default 30).
• Calculation Mode: “Exact % change” or “Max % change”.
• Y-Axis Scale: “Ratio” or “Percent”.
Open-source script
In true TradingView spirit, the creator of this script has made it open-source, so that traders can review and verify its functionality. Kudos to the author! While you can use it for free, remember that republishing the code is subject to our House Rules.

Disclaimer
The information and publications are not meant to be, and do not constitute, financial, investment, trading, or other types of advice or recommendations supplied or endorsed by TradingView. Read more in the Terms of Use.
Open-source script
In true TradingView spirit, the creator of this script has made it open-source, so that traders can review and verify its functionality. Kudos to the author! While you can use it for free, remember that republishing the code is subject to our House Rules.
Disclaimer
The information and publications are not meant to be, and do not constitute, financial, investment, trading, or other types of advice or recommendations supplied or endorsed by TradingView. Read more in the Terms of Use.