OPEN-SOURCE SCRIPT
Range Intelligence Suite [LuxAlgo]
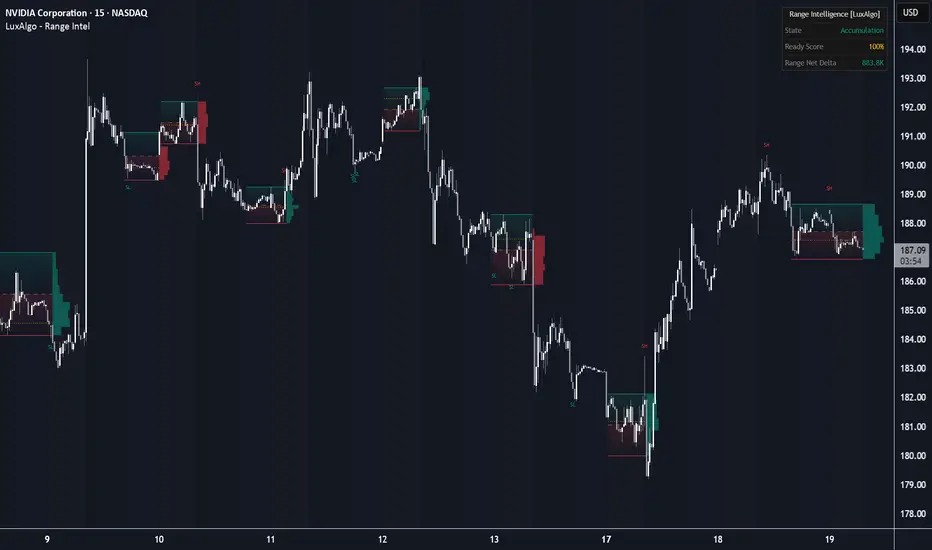
The Range Intelligence Suite indicator is a specialized consolidation analysis tool that identifies price ranges using ATR-based sensitivity and provides deep volume-based insights through a delta-coded profile and real-time dashboard.
🔶 USAGE
The indicator helps traders identify periods of market indecision (consolidation) and analyze the internal volume dynamics to predict potential breakout directions.
When the price enters a consolidation phase, the script automatically draws a range box with a mid-line and gradient shading. To the right of each range, a Volume Profile is generated, providing a structural view of where most trading activity occurred. This allows users to see not just the price boundaries, but the "fair value" areas within those boundaries.
🔹 Liquidity Sweeps
The script highlights "Fakeouts" or "Liquidity Sweeps" with labels. These occur when price briefly exits the range boundaries (High or Low) but fails to close outside, signaling a potential reversal back into the range or a "stop-run" before a real breakout.
🔹 Delta-Coded Volume Profile
Unlike standard volume profiles, this profile dynamically changes color based on the Net Delta of the range:
🔶 DETAILS
🔹 Range Detection Mechanism
The indicator determines a range by comparing the current price volatility to a historical average. It calculates the Highest High and Lowest Low over a user-defined lookback period (Detection Length).
A range is triggered when the total distance between that highest high and lowest low is less than the Average True Range (ATR) multiplied by the Range Sensitivity. Essentially, if the price action is "squeezed" into a vertical space smaller than the expected volatility, the script identifies it as a consolidation. The range remains active until a candle closes outside of these identified boundaries.
🔹 Dashboard Metrics
🔶 SETTINGS
🔹 Intelligence Core
🔹 Visual UX
🔹 Volume Profile
🔹 Dashboard
🔶 USAGE
The indicator helps traders identify periods of market indecision (consolidation) and analyze the internal volume dynamics to predict potential breakout directions.
When the price enters a consolidation phase, the script automatically draws a range box with a mid-line and gradient shading. To the right of each range, a Volume Profile is generated, providing a structural view of where most trading activity occurred. This allows users to see not just the price boundaries, but the "fair value" areas within those boundaries.
🔹 Liquidity Sweeps
The script highlights "Fakeouts" or "Liquidity Sweeps" with labels. These occur when price briefly exits the range boundaries (High or Low) but fails to close outside, signaling a potential reversal back into the range or a "stop-run" before a real breakout.
🔹 Delta-Coded Volume Profile
Unlike standard volume profiles, this profile dynamically changes color based on the Net Delta of the range:
- A bullish profile indicates the range is currently under accumulation (more buy volume than sell volume).
- A bearish profile indicates distribution (more sell volume than buy volume).
🔶 DETAILS
🔹 Range Detection Mechanism
The indicator determines a range by comparing the current price volatility to a historical average. It calculates the Highest High and Lowest Low over a user-defined lookback period (Detection Length).
A range is triggered when the total distance between that highest high and lowest low is less than the Average True Range (ATR) multiplied by the Range Sensitivity. Essentially, if the price action is "squeezed" into a vertical space smaller than the expected volatility, the script identifies it as a consolidation. The range remains active until a candle closes outside of these identified boundaries.
🔹 Dashboard Metrics
- State: Displays whether the current range is in a state of Accumulation, Distribution, or if the script is currently scanning for a new trend.
- Ready Score: A percentage-based metric that combines the duration of the range with the intensity of the net delta. A higher score suggests the range is "mature" and potentially nearing a significant breakout.
- Range Net Delta: The raw difference between buying and selling volume accumulated since the range began.
🔶 SETTINGS
🔹 Intelligence Core
- Detection Length: The lookback period used to identify consolidation ranges.
- Range Sensitivity: ATR multiplier that determines how "tight" the price must be to trigger a range. Lower values require tighter price action to start a range.
- Hide Overlapping Ranges: When enabled, only the most recent range is shown if multiple ranges overlap in time.
🔹 Visual UX
- Bullish/Bearish Color: Sets the primary colors for the ranges and volume profiles.
- Fill Transparency: Adjusts the opacity of the range background fills.
- Show Point of Control (POC): Displays the gold dotted line representing the price level with the highest total volume.
- Highlight Liquidity Sweeps: Toggles the labels for high/low fakeouts.
🔹 Volume Profile
- Show Volume Profile: Enables or disables the right-aligned volume histogram.
- Rows: Determines the vertical granularity of the profile. Lower values create thicker bins.
- Profile Max Width: Adjusts how far the profile extends horizontally to the right as a percentage of the range duration.
🔹 Dashboard
- Dashboard: Toggles the on-screen information table.
- Position/Size: Controls the location and scale of the dashboard UI.
Open-source script
In true TradingView spirit, the creator of this script has made it open-source, so that traders can review and verify its functionality. Kudos to the author! While you can use it for free, remember that republishing the code is subject to our House Rules.

luxalgo.com - Every plan includes access to all LuxAlgo invite-only indicators.
All content & scripts provided by LuxAlgo are for educational purposes only and are not financial advice.
All content & scripts provided by LuxAlgo are for educational purposes only and are not financial advice.
Disclaimer
The information and publications are not meant to be, and do not constitute, financial, investment, trading, or other types of advice or recommendations supplied or endorsed by TradingView. Read more in the Terms of Use.
Open-source script
In true TradingView spirit, the creator of this script has made it open-source, so that traders can review and verify its functionality. Kudos to the author! While you can use it for free, remember that republishing the code is subject to our House Rules.
luxalgo.com - Every plan includes access to all LuxAlgo invite-only indicators.
All content & scripts provided by LuxAlgo are for educational purposes only and are not financial advice.
All content & scripts provided by LuxAlgo are for educational purposes only and are not financial advice.
Disclaimer
The information and publications are not meant to be, and do not constitute, financial, investment, trading, or other types of advice or recommendations supplied or endorsed by TradingView. Read more in the Terms of Use.