Fibonacci Sequence Swing [ChartPrime]
More exclusive indicators from ChartPrime
Subscribe to ChartPrime Plus for $117.00/month to get exclusive indicators by this author. You pay right on TradingView and can use them on your charts straight away.
Explore ChartPrime Plus⯁ OVERVIEW
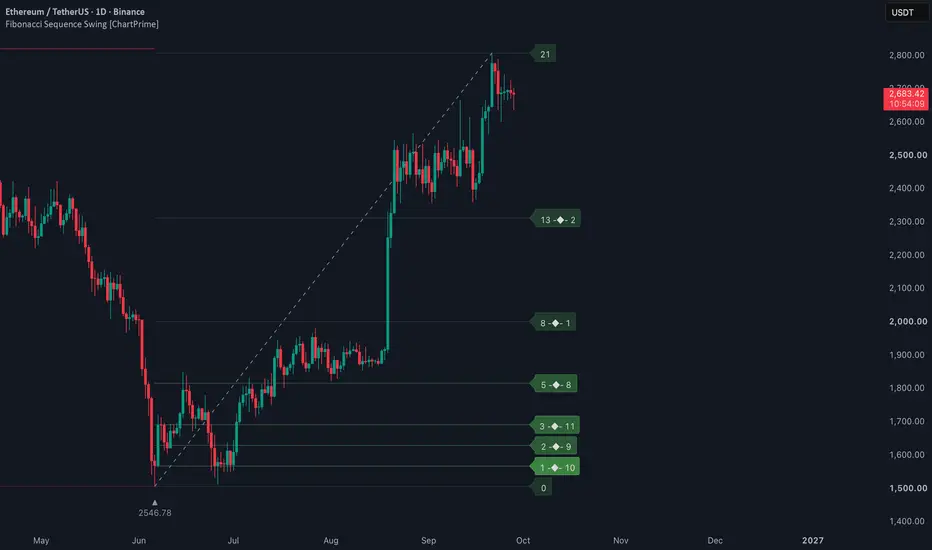
Fibonacci Sequence Swing is a structural swing-based Fibonacci tool that goes beyond classic retracement ratios.
Instead of fixed percentages, it uses the Fibonacci number sequence itself to divide each completed or forming swing and evaluates how price actually interacts with every level in real time.
The result is a dynamic map of structurally important Fibonacci levels, ranked by real market interaction rather than theory.
⯁ CONCEPT
⯁ HOW LEVEL IMPORTANCE IS CALCULATED
⯁ VISUAL LOGIC
⯁ LABEL INFORMATION
⯁ MAX RETEST INPUT
⯁ PRACTICAL INTERPRETATION
⯁ CONCLUSION
Fibonacci Sequence Swing transforms Fibonacci from a static drawing tool into a data-driven structural framework.
By ranking levels based on real price interaction, it highlights where the market has already shown respect — and where it has not — giving traders a deeper, probabilistic view of swing structure and internal liquidity behavior.
Fibonacci Sequence Swing is a structural swing-based Fibonacci tool that goes beyond classic retracement ratios.
Instead of fixed percentages, it uses the Fibonacci number sequence itself to divide each completed or forming swing and evaluates how price actually interacts with every level in real time.
The result is a dynamic map of structurally important Fibonacci levels, ranked by real market interaction rather than theory.
⯁ CONCEPT
- The indicator first detects market swings using a ZigZag-style structure.
- Once a swing is forming or confirmed, the full swing range is divided into Fibonacci sequence steps (0 → 21).
- Each Fibonacci sequence level becomes a horizontal reference level inside the swing.
- The importance of each level is determined by how many times price has interacted with it.
⯁ HOW LEVEL IMPORTANCE IS CALCULATED
- For every Fibonacci sequence level, the script scans historical candles within the active swing.
- An interaction is counted whenever price trades above and below the level (true overlap, not just a touch).
- The total number of interactions is stored as the Retest Frequency.
⯁ VISUAL LOGIC
- Color Intensity:
Levels with more interactions are drawn with stronger color intensity.
Weak or untouched levels remain faded. - Line Width:
Line thickness increases with interaction count, visually highlighting high-importance levels. - Directional Coloring:
Bullish swings use green-toned gradients.
Bearish swings use red-toned gradients. - Live Updating:
While a swing is active, levels continuously update as new interactions occur.
⯁ LABEL INFORMATION
- Labels are plotted on the right side of the chart.
- Each label shows:
- Fibonacci sequence number (0, 1, 2, 3, 5, 8, 13, 21)
- A ◆ symbol followed by the number of price interactions with that level
- This allows instant identification of the most respected levels inside the swing.
⯁ MAX RETEST INPUT
- The Retest input defines the maximum interaction count used for visualization scaling.
- Color intensity is normalized against this value.
- This prevents extreme retest counts from overpowering the visual hierarchy.
- Levels exceeding the maximum still remain visible but are capped in gradient strength.
⯁ PRACTICAL INTERPRETATION
- Levels with strong color and thick lines represent areas where price repeatedly reacted.
- These zones often behave as natural support/resistance inside the swing.
- Untested or weak levels may act as future targets or low-friction areas.
- The tool adapts automatically to new swings without manual anchoring.
⯁ CONCLUSION
Fibonacci Sequence Swing transforms Fibonacci from a static drawing tool into a data-driven structural framework.
By ranking levels based on real price interaction, it highlights where the market has already shown respect — and where it has not — giving traders a deeper, probabilistic view of swing structure and internal liquidity behavior.

Disclaimer
The information and publications are not meant to be, and do not constitute, financial, investment, trading, or other types of advice or recommendations supplied or endorsed by TradingView. Read more in the Terms of Use.
Disclaimer
The information and publications are not meant to be, and do not constitute, financial, investment, trading, or other types of advice or recommendations supplied or endorsed by TradingView. Read more in the Terms of Use.